VitalPro for Win32 - User Guide
|
Expert Health Data Programming, Inc.
Table of Contents
Chapter 1: Introduction
1-1: Advantages and Benefits
1-2: Data Within VitalPro
1-3: Accessing VitalPro
1-4: Confidentiality Policy
Chapter 2: Understanding Table Results
2-1: Typical VitalPro Table
2-2: Table #1 to Interpret
2-3: Table #1, Interpreted
2-4: Table #2 to Interpret
2-5: Table #2, Interpreted
Chapter 3: Using the Interface
3-1: Start at Main Menu
3-2: Use a Simple Menu
3-3: Use Area Sets Menu
3-4: Back at Main Menu
3-5: Produce a Table
3-6: Switch to Designing a Map
3-7: Continue with Analyses
3-8: More Practice Analyses
Chapter 4: Outlines of Menus
4-1: Table Layout Menus
4-3: Other Program Settings
4-4: Checklist of Key Tasks
Chapter 5: Basic Table Layout
5-1: Main Statistic (Outcome)
5-2: Rows, Columns, Row Sorting
5-3: By Variable (Multi-Tables)
Chapter 6: Data Variables
6-1: Geographic (Area Sets)
6-2: Categorical & Range Vars
Chapter 7: Charts and Maps
7-1: Bar Chart Coloring
7-2: Bar Chart Layout
7-3: Line Chart Settings #1
7-4: Line Chart Settings #2
7-5: Pie Chart Coloring
7-6: More Pie Chart Settings
7-7: Map Settings #1
7-8: Map Settings #2
7-9: Map Settings #3
7-10: Smart Output
Chapter 8: Other Parameters
8-1: Decimal Places
8-2: Trend Analysis
8-3: TXT, CSV, DBF Output
Glossary
Chapter 1: Introduction
Nature of the software - Vitalnet is a health data warehouse / data analysis system. Vitalnet includes both desktop (VitalPro) and internet-based (VitalWeb) systems. VitalPro and VitalWeb make analyzing data faster, easier, and more reliable. This user guide describes VitalPro for Win32, which runs directly on a PC or LAN. For convenience, we will often refer to the software as simply "VitalPro".
Advice about user guide - We have made VitalPro as self-explanatory as possible. You don't have to read this user guide. If you pay attention to the menus, you can fully use the software. However, we recommend you read the user guide because: (1) Many users learn better from a written text. (2) It is helpful to have an overview of what the software can do, to know it's capabilities, before using it. (3) The user guide explains many background concepts necessary for properly interpreting and using the data.
PDF and HTML versions - Viewing the PDF version of this user guide requires Adobe or other PDF reader. Viewing the HTML version requires any modern browser connected to the internet. The user guide is also designed to be printed.
Tutorial - This user guide incorporates a tutorial, to help you get started using the software. Tutorial sections are highlighted as shown in this example:
| Sample Tutorial Step - View the output in your browser. |
· Chapter 1: Introduction - Introduces Texas VitalPro for Win32 (VitalPro).
· Chapter 2: Understanding Table Results - Shows and explains typical VitalPro tables.
· Chapter 3: Using the Interface - Describes and shows how to use VitalPro menus.
· Chapter 4: Outlines of Menus - Lists VitalPro menus and capabilities.
· Chapter 5: Basic Table Layout - Explains how "table variables" (eg, rows) specify table layout.
· Chapter 6: Data Variables - Documents and explains variables such as race and age.
· Chapter 7: Charts and Maps - Explains map and chart (bar, line, pie) settings.
· Chapter 8: Other Parameters - Explains remaining parameters (eg, cell suppression).
· Glossary - Defines terms related to population data and VitalPro.
Citation for Vitalnet - Expert Health Data Programming, Inc., Texas VitalPro for Win32: Data Warehouse Software for Analyzing Texas Population Data. Bellevue, Washington. 1998-2019. Browse www.ehdp.com for more information about the software or to contact EHDP.
Acknowledgements - We gratefully acknowledge the suggestions and ideas we have received from Texas Department of State Health Services staff and other users. Please contact us at 888-709-5319 or at www.ehdp.com if you have suggestions or requests. We want to further improve VitalPro to meet your needs.
References for Vitalnet map color palettes - • LW Pickle, M Mungiole, GK Jones, AA White, "Atlas of United States Mortality", National Center for Health Statistics, 1997. • CA Brewer, "Color Use Guidelines for Mapping and Visualization", in "Visualization in Modern Cartography", Elsevier, 1994. • ColorBrewer web site showing color palettes.
Produced - "Apr 1 2023" "17:40:20"
Copyright 1998-2021 by Expert Health Data Programming, Inc. All rights reserved. DATA AWAREHOUSE, VITALNET, VITALWEB, and VITALPRO are trademarks of Expert Health Data Programming, Inc.
1-1: Advantages and Benefits
· VitalPro makes it easy to analyze Texas population data.
Fast - You get results in seconds or minutes. Depending on the analysis, alternate methods could easily require hours or days to complete. Or may be totally not practical.
Reliable - VitalPro helps prevent mistakes. It automatically incorporates needed complex algorithms and relationships. In contrast, analyses with SAS, SPSS, and other generic stats software are error-prone (besides being quite tedious). There are many steps that can go wrong in trying to manually analyze data.
Flexible - A wide variety of tables, charts and maps may be produced. You may set table rows and columns however you want. A large number of table, map, chart, and data parameters may be selected and combined as needed. On the other hand, if you choose you can ignore most program options, as they are set to reasonable default values.
Efficient - VitalPro goes beyond just being fast. For example, you can automatically make a whole series of tables with one keystroke (multi-tables), such as a separate table for each county. As another example, chart output is automatically produced whenever it makes sense, but NOT produced when it would look terrible or be invalid.
Data Awarehouse! - VitalPro is modern and efficient. An input Texas death file (one year) is 110 MB. The VitalPro death file is only 0.8 MB! The standard "data warehouse" file (same granularity) is 2,189 MB. VitalPro data is "smart": Each field "knows" what it is (eg, range, ICD) and what it does.
Easy to use - All operations are menu-driven, so you don't need to do tedious scripting. And you don't need to know any special codes such as FIPS codes.
Has online help - If needed, context-sensitive help is available from each menu. In addition, you may select from a list of on-line help topics, providing advice on topics related to VitalPro and data analysis. The on-line help complements the information in this user guide.
Fully documented output - VitalPro output helps prevent data misinterpretation. All output is fully documented, so (1) there is no confusion or question about the exact analysis that was done, and (2) the analysis can be exactly replicated if needed.
Makes charts and maps - VitalPro automatically makes charts (bar, line, and pie) and maps. The charts and maps can be customized in a wide variety of ways, as explained later.
Integrates with other software - VitalPro automatically displays HTML output in your desktop browser. And the HTML may be imported into word processing software. In addition, the following alternative formats are automatically made along with each analysis, to allow importing the results into other software tools: (1) ASCII text format, (2) delimited format for importing into spreadsheets, (3) dBASE III format for importing into statistical, GIS, mapping, graphing and other software, (4) PNG, PDF, SVG and GIS map formats.
Can be customized - Let us know if other capabilities you would like added. We want to further improve VitalPro to meet your needs.
1-2: Data Within VitalPro
· VitalPro links and analyzes population and geographic data.
Geographic information - VitalPro includes a database of Texas counties and regions, linked to the population data sets. Boundary files are included for making maps.
Population data - The Center for Health Statistics at DSHS provides 1980-1999 Texas population data. The Texas State Data Center provides Texas population data for 2000 and beyond. The Texas State Data Center periodically revises its estimates for years between censuses, but the changes are typically small. The population variables included within VitalPro are age, county of residence, race, sex, and year.
1-3: Accessing VitalPro
· Access VitalPro on a standalone Windows PC or via LAN.
Local access (PC's and local area networks) - You may use Texas VitalPro on a stand-alone PC or laptop running any version of Windows. Texas VitalPro may also be run from a local area network. Generally, VitalPro runs faster from a standalone installation, since it does not have to send data over the network.
Execution speed - VitalPro is fast. The software has been tested to produce rapid results on any Windows PC, and simply runs faster on faster computers. Analyses that might otherwise take hours to days to set up and run are done in seconds or minutes.
The software execution speed depends on:
• Speed of the computer you are using.
• Speed of the network you are working on.
• Specific analysis you are doing (greatest effect).
It typically takes a second or two to generate output.
1-4: Confidentiality Policy
· Texas VitalPro users must comply with confidentiality requirements.
Confidentiality policy - Your use of Texas VitalPro indicates your agreement to the following conditions: You will not try to use Texas VitalPro results nor let anyone else use Texas VitalPro results for any purpose other than statistical analysis. If you discover the identity of a population number, you will advise the Director of the Center for Health Statistics at the Texas Department of State Health Services of the incident, will safeguard or delete the information that would identify the individual, will make no use of the knowledge, and will inform no one else of the discovered identity.
Chapter 2: Understanding Table Results
What's in this chapter - VitalPro makes tables, charts, data files, and maps. Before jumping in and using VitalPro (next chapter), it is helpful to get a good understanding of VitalPro table results, and see some practical output table examples.
First, this chapter explains the four sections of a VitalPro table:
• Header - Basic analysis parameters.
• Data section - Numerical results.
• Tabular chart - Optional simple graphic.
• Footnotes - Other analysis parameters.
As appropriate, a VitalPro table may include a graphic chart (bar, line, or pie). Graphic charts (and when they are made) are explained and illustrated later in this user guide.
Second, this chapter shows examples of two Texas VitalPro tables, to give you an idea of what is possible. You are given an opportunity to practice interpreting the sample tables.
2-1: Typical VitalPro Table
· Each table has four parts: header, data section, optional tabular chart, footnotes.
Population Tabulated by Age and Sex Years: 2000 Place of Residence: Galveston, Harris Age Male Female Total ----------------------------------------------- Birth-19 566,937 547,337 1,114,274 20-39 582,844 574,295 1,157,139 40-59 454,842 471,562 926,404 60-99+ 155,304 202,304 357,608 ----------------------------------------------- Total 1,759,927 1,795,498 3,555,425 Horizontal Bar Graphs (X = 38,856 Population, x = 19,428): Age Male Female ------------------------------------------- Birth-19 XXXXXXXXXXXXXXx XXXXXXXXXXXXXX 20-39 XXXXXXXXXXXXXXX XXXXXXXXXXXXXXX 40-59 XXXXXXXXXXXx XXXXXXXXXXXX 60-99+ XXXX XXXXX ------------------------------------------- Analysis Footnotes: Unique ID, for Keeping Track of Analyses: 414MRQKR Output Produced: Sat Apr 14 10:55:52 2001, by Texas VitalNet Population Data Source (Pre-1990): TDH State Health Data (1/95) Population Data Source (1990+): TAMU TX State Data Center (8/98) |
Header: Documents major parameters for the analysis. The table analyzes 2000 population for Galveston and Harris counties.
Data Section: Contains the results, organized into columns and rows. In this example, there is one column for each sex and one row for each of four age groups. Verify there were 471,562 women age 40-59, 1,759,927 males, and a total of 3,555,425 residents. Each result (such as 471,562) is called a "cell".
Optional Tabular Chart: Represents the results in a text-based horizontal bar graph format. May be turned off by user via a menu option. Is automatically turned off if a graphical chart (bar, line, pie) is shown. In the above example, each 'X' (big X) symbol represents 38,856 population. The tabular chart clearly shows that the greatest population is in the 20-39 age group, for both sexes.
Footnote: Documents additional details related to the analysis, such as data sources and when the table was produced. Usefully, each table is assigned a unique ID for future reference.
2-2: Table #1 to Interpret
Here is a sample table (footnotes omitted) for you to practice on. Try interpreting the table by filling in the spaces below. Then, check your answers with those on the next page.
Population Tabulated by Race-Ethnicity and Sex Years: 2000 Place of Residence: Galveston, Harris Race Male Female Total ----------------------------------------------- White 814,096 846,813 1,660,909 Black 288,063 333,237 621,300 Hispanic 552,787 512,603 1,065,390 Other 104,981 102,845 207,826 ----------------------------------------------- Total 1,759,927 1,795,498 3,555,425 Horizontal Bar Graphs (X = 56,454 Population, x = 28,227): Race Male Female ------------------------------------------- White XXXXXXXXXXXXXXx XXXXXXXXXXXXXXX Black XXXXX XXXXXX Hispanic XXXXXXXXXX XXXXXXXXX Other XX XX ------------------------------------------- |
| Header | Outcome (main statistic): | ___________________ |
| Years analyzed: | ___________________ | |
| Geographic areas analyzed: | ___________________ | |
| Age groups analyzed: | ___________________ | |
| Data Section | Row variable: | ___________________ |
| Column variable: | ___________________ | |
| How many females, total: | ___________________ | |
| How many Hispanic males: | ___________________ | |
| Tabular Chart | Population symbolized by big 'X': | ___________________ |
2-3: Table #1, Interpreted
Here is the same table, and a suggested interpretation. If you had a problem, try reading through the answers again or ask a local data analyst for help.
Population Tabulated by Race-Ethnicity and Sex Years: 2000 Place of Residence: Galveston, Harris Race Male Female Total ----------------------------------------------- White 814,096 846,813 1,660,909 Black 288,063 333,237 621,300 Hispanic 552,787 512,603 1,065,390 Other 104,981 102,845 207,826 ----------------------------------------------- Total 1,759,927 1,795,498 3,555,425 Horizontal Bar Graphs (X = 56,454 Population, x = 28,227): Race Male Female ------------------------------------------- White XXXXXXXXXXXXXXx XXXXXXXXXXXXXXX Black XXXXX XXXXXX Hispanic XXXXXXXXXX XXXXXXXXX Other XX XX ------------------------------------------- |
| Header | Outcome (main statistic): | Population |
| Years analyzed: | 2000 | |
| Geographic areas analyzed: | Galveston, Harris Counties | |
| Age groups analyzed: | All ages | |
| Data Section | Row variable: | Row for each race |
| Column variable: | Column for each sex | |
| How many females, total: | 1,795,498 | |
| How many Hispanic males: | 552,787 | |
| Tabular Chart | Population symbolized by big 'X': | 56,454 |
2-4: Table #2 to Interpret
Here is another table. Fill in the spaces below. Then, check your answers on the next page.
Median Population Age (Years)
Tabulated by Area Set and Sex
Years: 2000
Place of Residence: Harris, Hidalgo, Kerr

                            Male               Female                Total
Area Set      Median, Population   Median, Population   Median, Population
--------------------------------------------------------------------------
Kerr              40.9    20,139       45.8    22,393       43.4    42,532
Harris            31.0 1,644,682       32.4 1,675,755       31.7 3,320,437
Hidalgo           25.3   268,839       27.3   277,812       26.3   546,651
--------------------------------------------------------------------------
Total             30.2 1,933,660       31.8 1,975,960       31.0 3,909,620

Horizontal Bar Graphs (X = 3.1 Years, x = 1.5):

            Male            Female          Total
Area Set    Median          Median          Median
-----------------------------------------------------------
Kerr        XXXXXXXXXXXXXx  XXXXXXXXXXXXXXX XXXXXXXXXXXXXX
Harris      XXXXXXXXXX      XXXXXXXXXXx     XXXXXXXXXXx
Hidalgo     XXXXXXXXx       XXXXXXXXX       XXXXXXXXx
-----------------------------------------------------------
Total       XXXXXXXXXX      XXXXXXXXXXx     XXXXXXXXXX
|
| Header | Outcome (main statistic): | ___________________ |
| Years analyzed: | ___________________ | |
| Geographic areas analyzed: | ___________________ | |
| Data Section | Row variable: | ___________________ |
| Column variable: | ___________________ | |
| Harris County median population: | ___________________ | |
| Total population for areas analyzed: | ___________________ | |
| Female median for Kerr County: | ___________________ | |
| Tabular Chart | Median pop symbolized by big 'X': | ___________________ |
2-5: Table #2, Interpreted
Here is the second table again, and our interpretation of the results.
Median Population Age (Years)
Tabulated by Area Set and Sex
Years: 2000
Place of Residence: Harris, Hidalgo, Kerr

                            Male               Female                Total
Area Set      Median, Population   Median, Population   Median, Population
--------------------------------------------------------------------------
Kerr              40.9    20,139       45.8    22,393       43.4    42,532
Harris            31.0 1,644,682       32.4 1,675,755       31.7 3,320,437
Hidalgo           25.3   268,839       27.3   277,812       26.3   546,651
--------------------------------------------------------------------------
Total             30.2 1,933,660       31.8 1,975,960       31.0 3,909,620

Horizontal Bar Graphs (X = 3.1 Years, x = 1.5):

            Male            Female          Total
Area Set    Median          Median          Median
-----------------------------------------------------------
Kerr        XXXXXXXXXXXXXx  XXXXXXXXXXXXXXX XXXXXXXXXXXXXX
Harris      XXXXXXXXXX      XXXXXXXXXXx     XXXXXXXXXXx
Hidalgo     XXXXXXXXx       XXXXXXXXX       XXXXXXXXx
-----------------------------------------------------------
Total       XXXXXXXXXX      XXXXXXXXXXx     XXXXXXXXXX
|
| Header | Outcome (main statistic): | Median population |
| Years analyzed: | 2000 | |
| Geographic areas analyzed: | Harris, Hidalgo, Kerr | |
| Data Section | Row variable: | Row for each area |
| Column variable: | Column for each sex | |
| Harris County median population: | 31.7 | |
| Total population for areas analyzed: | 3,909,620 | |
| Female median for Kerr County: | 45.8 | |
| Tabular Chart | Median pop symbolized by big 'X': | 3.1 years |
Chapter 3: Using the Interface
What's in this chapter - Finally, you will get to use VitalPro! This is probably what you have been waiting for! You will learn to navigate the interface, select parameters, and produce a few tables like those you learned about in the previous chapter.
Some advice about learning - As you use VitalPro, we encourage you to explore and try things. Don't be shy. You cannot cause any damage by using the software. VitalPro does a lot, and there are a lot of options, because analyzing data has many options. But running the software is pretty simple, once you know the basic way it works.
Open default browser - Your Windows PC has a "default browser" set up. That's the browser that normally displays HTML files (web pages) for you. Before you start VitalPro, open the default browser. Eventually, when you make output from VitalPro, the output will display in the browser. The preferred browsers are Firefox, Internet Explorer, Safari, and Opera. Note: Many Chrome versions have a bug, do not display local files via Javascript, so Chrome may fail to display time trend maps.
Access the software - A tutorial runs through this chapter. All procedures you are expected to do as part of the tutorial are highlighted in a different type style, as shown below. At this point, do the following:
| Start Texas VitalPro for Win32 by clicking on the icon. |
VitalPro runs in a "Win32 Console". This is a special interface available on all Windows computers. You will start at the Main Menu (shown on next page).
3-1: Start at Main Menu
· You will constantly return to the Main Menu.

After VitalPro starts in the Win32 Console, you are presented with the Main Menu, similar to the picture above.
The Main Menu is the "command center" - You move to submenus to modify parameters, but return to the Main Menu to make a table (or map). The Main Menu lists all parameters currently selected. It provides an overview of the current analysis scenario.
Menu Level - Note the words "Main Menu" in the upper right corner. This is also "Menu Level 1". For each submenu, as shown on the next page, the "Menu Level" is indicated: 2, 3, etc.
Highlighting a parameter - One of the parameters is always highlighted. In the example above, "Output Type" is highlighted. You move the highlight by pressing an arrow key. The parameter list scrolls as needed. Note that you do not use a mouse to navigate the VitalPro menus. This "non-mouse" operation may seem odd at first, but it proves to be fast and easy. Do the following:
|
Press ↓ (down arrow key) to move the highlight down.
Keep pressing the "down arrow key" to scroll down more. |
Changing window appearance - The font size for the Win32 Console running VitalPro may be changed from the Win32 Console toolbar, to suit your screen. "Raster Fonts" set to "8 x 12", as shown, is a reasonable font. In addition, on some computers, the Win32 Console may be toggled to full screen (and back) by pressing ALT-ENTER (hold down ALT key and press ENTER key). Try it.
3-2: Use a Simple Menu
· Access a submenu by highlighting an item and pressing ENTER.

Selecting parameter to change - To change a parameter: First, highlight the parameter (using the arrow keys). Then, press ENTER.
Quick changes - Some parameters have a relatively simple menu. Try this:
|
Highlight "Spreadsheet Format" by using arrow keys.
Press ENTER to access the submenu. Select TSV format. Press ESCAPE (or '=') to return to the Main Menu. |
|
Highlight "Geographic Areas" by using arrow keys.
Press ENTER to access the submenu. |
3-3: Use Area Sets Menu
· Each menu guides you in selecting parameters.

If you have carried out the tutorial steps, your screen will look similar to the above screen. If your screen looks different, go back and try again. It is very simple: Highlight an item on the Main Menu using the arrow keys. Then, press ENTER.
Menu with scrolling window - You are now on the "Area Sets" menu, at "Level 2". This is a typical VitalPro menu. It has a scrolling window with a list of items, "Area Sets" in this case. One of the items will be highlighted, and you can move the highlight by using the arrow keys.
Letters are action items - This menu has a list of actions, such as " B Delete all sets". Pressing the letter (such as 'B') carries out the action.
Adding an area - Carry out the following steps to add an area:
|
1. Press 'B' to delete all area sets. Confirm if asked.
2. Then, press 'A' to add some areas. 3. Highlight "PHR 1" (use arrow keys) and press ENTER to add. 4. Then, press ESCAPE (or '=') to return to "Area Sets" menu. 5. Note that "PHR 1" is added to the scrolling window. 6. Finally, press ESCAPE (or '=') to return to the Main Menu. |
3-4: Back at Main Menu
· You always return to the Main Menu after modifying a parameter.

Make sure you're back - You should now be back at the Main Menu, shown above. Note that "Geographic Areas" has been modified (it is now set to PHR 1). If you are not back at the Main Menu, get assistance from a co-worker familiar with using the software. Or (in almost all cases), simply press the ESCAPE key a few times to return to the Main Menu.
3-5: Produce a Table
· Press the letter 'P' at the Main Menu to make a table.
Check that you at the Main Menu - You should now be back at the Main Menu, as explained on the previous page. You have used the menus to select a few parameters, and are now ready to produce your first table!
| Press 'P' to produce a table (top of output shown): |

Time required - The amount of time required depends on which parameters are selected and what kind of computer you are using, but is typically a few seconds.
Examining the table - The output will automatically appear in your default desktop browser (which you previously opened). The bottom of the output (not shown above) contains links to spreadsheet, text, and dBASE III output. In addition, there may be links to bar, pie, or line chart output.
|
1. View (and maybe print) the output displayed in your browser.
2. If desired, click on some links at bottom of the output. 3. If desired, delete output browser window (CTL-W). 4. Using mouse, click on VitalPro Main Menu to return to program. |
3-6: Switch to Designing a Map
· From the Main Menu, you may switch to designing a map, as shown below.

You've got the basics - You've navigated the Main Menu, used submenus to select parameters, made an output table, and viewed the output. That's about all there is to operating the software! It's a simple, fast, powerful analysis cycle. You should be getting the hang of VitalPro by now. If not, talk with a coworker or contact us.
PNG, PDF, SVG and GIS maps - VitalPro also makes a wide variety of map formats. And you can customize the maps in a wide variety of ways to meet your needs: add area labels, switch between boundary types (eg, regional boundaries), set the number of colors to use, select a color palette, set the range type (eg, "equal interval"), select time trend maps (map for each year range). These options are described and illustrated later in this user guide.
Make a map - Since tables and maps are so fundamentally different (eg, maps don't have rows, tables don't have colors), VitalPro displays a simpler menu system (shown above) when designing a map. To make your first map:
|
1. At Main Menu, highlight "Output Type" (first option).
2. Press ENTER, and on submenu select "Map" output type. 3. Back on Main Menu, press "P" to produce a map. |
3-7: Continue with Analyses
· VitalPro lets you quickly carry out a wide variety of analyses.
Explore the menus - Once you get the hang of it, using VitalPro is easy. If you have gotten this far, you understand the basic program operation.
Don't be afraid to experiment and try out different options. Once you have made a table (or map), look it over. If it meets your needs, you're done. If the output is not quite right, look over the parameters on the Main Menu, highlight the parameter you want to change, and press ENTER. A submenu will lead you through the modification process. After setting all parameters as desired, return to the Main Menu and produce another table (or map) by pressing 'P'. Try it:
|
1. At the Main Menu, modify a parameter or two. 2. Then, press 'P' to produce and view another table (or map). 3. Try some of the sample analyses shown later. |
| At the Main Menu, press '?' and explore the help system. |
Suggestions to avoid misinterpretation:
• Double-check header and footer to verify it was the analysis you intended.
• Acknowledge possible confounding variables (eg, socioeconomic status).
• Acknowledge the possibility of census miscounts.
• Acknowledge difficulty estimating population in years between censuses.
• Use confidence intervals to help determine statistical significance.
• Use fewer rows and columns for a simpler presentation.
• Use more rows and columns if more comparisons and detail are needed.
• Use confidence intervals to help determine statistical significance.
• Graphic charts make the data story easier for viewers to understand.
• If uncertainties remain, contact local data experts for advice.
3-8: More Practice Analyses
For additional practice, and to gain more understanding of how VitalPro can speed and simplify data analysis, carry out the following sample analyses. If a variable is not listed (eg, Sex), then all values are selected (eg, Male and Female). Do the following:
|
Select parameters as shown below. Then, press 'P' on Main Menu to produce output. |
Statistic - Population
Area sets - All
Area sets - All
Second format - Delimited
Row for each - Age group
Races - All
Row for each - Age group
Races - All
Table for each - Area set
Ages - 20-year groups
Years - 1995
Ages - 20-year groups
Years - 1995
2. Counties ranked by median age of population:
Statistic - Median population age
Area sets - All counties
Years - 1995
Area sets - All counties
Years - 1995
Column for each - One only
Row for each - Area set
Races - All
Row for each - Area set
Races - All
Table for each - One only
Ages - All ages
Ages - All ages
3. Time trend for median age of female population:
Statistic - Median population age
Area sets - All counties
Years - All
Area sets - All counties
Years - All
Column for each - One only
Row for each - Year
Races - All
Row for each - Year
Races - All
Table for each - One only
Ages - All ages
Sex - Female
Ages - All ages
Sex - Female
4. Race / sex breakdown of population for one area
Statistic - Population
Area sets - Travis
Years - 2000
Area sets - Travis
Years - 2000
Column for each - Sex
Row for each - Race
Races - All
Row for each - Race
Races - All
Table for each - One only
Ages - All ages
Sex - Both
Ages - All ages
Sex - Both
Chapter 4: Outlines of Menus
What other menus and options are available? - If you have done the examples in the previous chapter, you should have a good understanding of how to use VitalPro menus to select parameters. However, you have just scratched the surface of the capabilities and power of the software. For your reference, the following pages list all of the Texas VitalPro for Win32 menus. The purpose of the list of menus is to help you become aware of what is available so that you can take fullest advantage of the software. Do this:
|
Look at the outlines below and on following pages.
Using the outlines, explore VitalPro for Win32 menus. Move up and down through the menus. Check out all the menus. |
• Table or Map
• Main Statistic
Design table layout (if making table):
• Row Variable
• Row Sorting
• Column Variable
• Multi-Tables
Modify data variables:
• Age Groups
• Area Sets (If Making Table)
• Race
• Sex
• Year Ranges
Modify other program settings:
• Chart Settings (If Making Table)
• Map Settings (If Making Map)
• Secondary Statistics
• Output HTML Settings
• Various Other Settings
From Main Menu, carry out an action:
• Produce Table and Charts
• Produce Map
• Exit VitalPro for Win32
4-1: Table Layout Menus
· Using VitalPro for Win32, explore menus for designing table layout.
Row Menu selects "Row Variable":
• Age
• Area of Residence
• Race
• Sex
• Year
Possible some of above not in your version.
Column Menu has the same options.
Multi-Table Menu has the same options.
• Age
• Area of Residence
• Race
• Sex
• Year
Possible some of above not in your version.
Column Menu has the same options.
Multi-Table Menu has the same options.
Row Sorting Menu options:
• Rows unsorted
• Rows sorted by total data, high to low
• Rows sorted by total data, low to high
• Rows unsorted
• Rows sorted by total data, high to low
• Rows sorted by total data, low to high
4-2: Data Variable Menus
· Using VitalPro for Win32, explore menus for modifying variables.
Race Menu / Sex Menu:
• Select categories as sets
• Delete one / all sets
• Merge sets into new set
• Split previously merged set
• Select categories as sets
• Delete one / all sets
• Merge sets into new set
• Split previously merged set
Age Groups Menu:
• Use standard grouping, eg 10-year
• Modify upper / lower end of a group
• Split a group into separate groups
• Delete an age group
• Use standard grouping, eg 10-year
• Modify upper / lower end of a group
• Split a group into separate groups
• Delete an age group
Year Ranges Menu:
• Use standard grouping, eg 2-year
• Modify upper / lower end of a range
• Split a range into individual years
• Delete a year range
• Use standard grouping, eg 2-year
• Modify upper / lower end of a range
• Split a range into individual years
• Delete a year range
Area Sets Menu:
• Add some areas (submenu)
• Delete one / all area sets
• Merge area sets into new set
• Split area set into sub-areas
• Add some areas (submenu)
• Delete one / all area sets
• Merge area sets into new set
• Split area set into sub-areas
4-3: Other Program Settings
· Using VitalPro for Win32, explore other settings listed below.
Chart / Map Settings:
• Bar Chart Settings - Described Fully Later
• Line Chart Settings - Described Fully Later
• Pie Chart Settings - Described Fully Later
• Map Settings - Described Fully Later
• Bar Chart Settings - Described Fully Later
• Line Chart Settings - Described Fully Later
• Pie Chart Settings - Described Fully Later
• Map Settings - Described Fully Later
Secondary Statistics:
• Decimal Digits - Example: Two in 5.78
• Table Percents - Row or Column Percents
• Trend Confidence - Set Level, or Turn Off
• Decimal Digits - Example: Two in 5.78
• Table Percents - Row or Column Percents
• Trend Confidence - Set Level, or Turn Off
Output HTML Settings:
• HTML Line Style - Line Style for Output HTML
• HTML Output Font - Text Font for Output HTML
• HTML Padding - Padding for Output HTML Table
• HTML Line Style - Line Style for Output HTML
• HTML Output Font - Text Font for Output HTML
• HTML Padding - Padding for Output HTML Table
Various Other Settings:
• FIPS in Output - FIPS Codes in Table?
• Menu Color Scheme - Example: Blue on Red
• Spreadsheet Format - Spreadsheet Data Format
• Tabular Chart - Chart Width, or Omit Chart
• Unique ID - Put ID on Maps and Charts?
• Output Comment - One-Line Note You Enter
• Output Directory - Folder for Output Files
• Output File Prefix - Example: 2021-09-12
4-4: Checklist of Key Tasks
This checklist gives an overview of the main capabilities of VitalPro for Win32, and the tasks you might normally do to analyze the data. You don't have to do everything listed below. Most of the parameters can be left at default values, with no problem. For example, you are always going to get a nice pie chart, even with the default settings. But it is helpful for you to be aware of what is available, for example in case you want a bigger pie chart.
Get started:
· Switch to designing a map
· Switch to designing a table
· Select outcome (main statistic)
Table layout:
· Select row variable and row sorting
· Select column variable
· Select multi-tables (table series)
Age groups:
· Select grouping (eg 5-year groups)
· Split a group (eg, 10-11 --> 10 + 11)
· Delete a group
For low end of age group:
· Decrease (eg, 11-13 --> 10-13)
· Increase (eg, 11-13 --> 12-13)
For high end of age group:
· Decrease (eg, 10-12 --> 10-11)
· Increase (eg, 10-12 --> 10-13)
Viewing output:
· Produce output from Main Menu
· View HTML output in browser
· View text output in browser
· View pie / bar / line charts
· View CSV / TSV in spreadsheet
Other tasks:
· Use help system
· Change output directory
· Change output prefix
· Change various other settings
Race sets:
· Select some race sets
· Delete a race set
· Merge some sets
· Split a race set
Area sets:
· Select some area sets
· Delete an area set
· Merge some sets
· Split an area set
Chart and map settings:
· Modify bar chart settings
· Modify line chart settings
· Modify pie chart settings
· Modify map settings
Secondary statistics:
· Change decimal places
· Turn on row percents
· Turn on column percents
Chapter 5: Basic Table Layout
What's in this chapter - This chapter explains what we call "table variables". Table variables are the basic variables that determine the basic layout of an output table. VitalPro allows great flexibility in designing your table. Also, the software prevents incompatibilities from occurring.
The table variables are:
· Main Statistic
· Row Variable
· Row Sorting
· Column Variable
· Multi-Tables
5-1: Main Statistic (Outcome)
· The Main Statistic is the basic type of number in a table (or map).
What is a Main Statistic? - Every table (or map) has a Main Statistic. No exceptions. The Main Statistic (or outcome) is the basic type of data generated in the output. Each Main Statistic is defined in the glossary, and on-line help files give the full calculation methods.
Available Statistics -
· Population
· Median population age
· Percent population in age group
5-2: Rows, Columns, Row Sorting
· Table rows and columns may be set as needed, and rows can be sorted.
Rows and columns - Rows are horizontal lines in a data table. Columns go up and down.
Every table has a "row variable" and a "column variable". Rows and columns may be set to any of the following:
• Only one row (or column) (not set to a variable)
• One row (or column) per selected age group
• One row (or column) per selected area set
• One row (or column) per selected sex
• One row (or column) per selected race set
• One row (or column) per selected year range
Row sorting - Rows can optionally be sorted.
The VitalPro default is "unsorted rows" (standard order). Examples of unsorted rows include:
• Area sets in alphabetical order, such as Bexar before El Paso
From the "row sorting" menu, you can tell VitalPro to sort table rows as follows:
• Rows sorted from high to low, by total data
• Rows sorted from low to high, by total data
Columns cannot be sorted, instead always appear in standard order.
5-3: By Variable (Multi-Tables)
· You may automatically produce a series of tables.
Population Tabulated by Race-Ethnicity and Sex Years: 1990 Place of Residence: Anderson Race Male Female Total -------------------------------------- White 17,023 15,656 32,679 Black 7,714 3,387 11,101 Hispanic 2,910 1,037 3,947 Other 174 123 297 -------------------------------------- Total 27,821 20,203 48,024 *** Tables omitted to save space *** Population Tabulated by Race-Ethnicity and Sex Years: 1990 Place of Residence: Zavala Race Male Female Total ------------------------------------- White 446 511 957 Black 277 8 285 Hispanic 5,392 5,482 10,874 Other 26 20 46 ------------------------------------- Total 6,141 6,021 12,162 |
Purpose of multi-tables - Suppose you want to make a separate table for each county. It would be quite tedious to select the first county, make a table, select the second county, make a table, etc. Multi-tables automates the production of such a series of tables into one operation. See the table series above for an example. The multi-table setting may be one of the following:
· Only one table (the default)
· One table per selected age group
· One table per selected area set
· One table per selected race set
· One table per selected year range
Multi-tables are very powerful and a big time-saver.
Chapter 6: Data Variables
What's in this chapter - This chapter lists and explains data variables you can modify using VitalPro. The software allows great flexibility in selecting and modifying data variables. You can select variables into "ranges" (eg, 2009-2010) and "sets" (eg, "White + Black") just about any way needed.
Here are the data variables covered in this chapter:
· Geo Selection (Area Sets)
Categorical variables:
· Race
· Sex
Range variables:
· Age Groups
· Years
6-1: Geographic (Area Sets)
· Every table has a geographic specification.
Geographical Areas - VitalPro analyzes Texas data to the county level, and also easily allows pre-set and ad-hoc county groupings. Texas has 254 counties, organized into regions (a group of several counties), as follows:
• 8 Health Service Regions (HSR)
• 11 Public Health Regions (PHR) (Effective 3/1/93)
• 25 Metropolitan Statistical Areas (MSA) (and the Remainder)
• 24 Councils of Government (COG)
• 15 Immediate Border Counties (vs Remaining Counties)
• 32 La Paz Border Counties (vs Remaining Counties)
Area Sets - One or more geographic areas may be combined into an "area set", and compared with other sets. For example, Bell County and Travis County can be combined into an area set. VitalPro makes it easy to combine areas into sets. Later, you split the set up. Or combine some sets to make a new set. Bottom line: VitalPro makes it easy to compare results between different groupings ("sets") of geographic areas (counties and county groupings), or limit analysis to specific geographic areas.
Selection is quick and easy - All geographic operations are grouped together on one menu, to allow quick and easy selection of any combination of areas desired. A previous interface snapshot (page 3-3) shows the main geographic menu.
6-2: Categorical & Range Vars
Race Groups (Categorical)
You may select any combination of race groups to analyze, by combining races (eg, Black, White) into "sets" as needed. A separate submenu allows easy selection. Keep in mind that differences in health status between races may be due to socio-economic differences.
Each count is classified as White, Black, Hispanic, or Other, as assigned by the Texas State Data Center.
Sex (Categorical)
You may select Male, Female, or both sexes combined.
Age Groups (Range)
VitalPro lets you combine and analyze age groups in just about any way needed. You may select any contiguous combination of age groups to analyze, such as 22-34. Or, you may select a set of ranges, such as birth-19, 20-39, 40-64, 65-99+.
VitalPro will let you know which age groups are available for use. Standard age groupings, such as 5-year, 10-year, and 20-year age groups are easily selected. Once you have a standard grouping selected, you may combine them in just about any way desired.
Up to age 21, 1-year ages are used (for example, 3 or 11-17). For 22 and over, an age group may use any combination of 5-year groups (for example, 40-44 or 30-49). The highest group is currently 75-99+ (75 and over).
Years (Range)
You may select any continuous range of one or more years to analyze, such as 1980-1983. In addition, you may select a set of year ranges for comparing, such as 1990-1991, 1992-1993, 1994-1995. VitalPro will let you know which years are available for use. Standard groupings, such as 1-year, 2-year, and 3-year groups are easily selected. Year groups may be combined in just about any way desired.
6-3: Causes of Death (ICD Sets)
· Mortality tables always include causes of death.
VitalPro classifies causes of death with ICD codes. ICD stands for "International Classification of Diseases", the standard system for classifying causes of death.
ICD-10 codes - Each disease or condition has either: (1) a 3-digit ICD-10 code (one letter followed by two digits) (for example, ICD-10 C53 for cervical cancer), or (2) a 4-digit ICD code (for example, ICD-10 G71.0 for muscular dystrophy). As of 1999, mortality data use ICD-10.
ICD-9 codes - Data from 1980 to 1998 use the 9th revision of the ICD system (ICD-9). As with ICD-10, each disease or condition has a separate 3-digit or 4-digit ICD-9 code. However the codes look different, as the ICD-9 codes are all numbers (no letters). For example, ICD-9 250 for diabetes mellitus, and ICD-9 005.1 for botulism. Otherwise, ICD-9 works basically the same as ICD-10. Note that there are many changes in the categories, so ICD-9 and ICD-10 results cannot always be directly compared.
ICD groups and sets - An ICD group is one or more consecutive ICD codes An ICD set is one or more ICD groups combined. For example,
Number of ICD groups - At the broadest level, the ICD-9 system has 17 major disease categories. At the most detailed level, there are about 5,000 four-digit codes. For codes 800-999 (injury and poisoning), VitalPro uses external cause codes (ICD-9 E-codes), standard for mortality analysis. At the broadest level, the ICD-10 system has 19 major disease categories. At the most detailed level, there are about 7,600 four-digit ICD-10 codes.
Selecting ICD groups - VitalPro allows you to easily select and combine ICD groups to meet your analysis needs. You may select ICD sets by:
(1) Entering the range (for example,
(2) Selecting from ICD "tree" menus, organized to allow you to narrow your focus without having to know the specific code.
(3) Selecting from one of several standard ICD lists of commonly used codes.
(4) Selecting one of the entire standard lists. For example, for easily calculating leading causes of death, select the NCHS list of potential leading causes.
VitalPro automatically formats leading cause reports. This saves you the trouble of converting ICD codes such as ICD_CODE_TO_USE and set numbers such as "Set #18" to descriptive terms such as "Diabetes" and "Heart Disease".
Chapter 7: Charts and Maps
What's in this chapter - This chapter explains about settings for VitalPro charts and maps.
Charts are very helpful for scanning results for trends, and for better communicating findings to others. Plus, they make the data more attractive, less boring. VitalPro makes three kinds of graphic charts. Each chart type is more or less best suited for a particular purpose:
Bar Charts
• Compare amounts of different things.
• For example, which race group has a higher birth rate?
• Or, which sex has more deaths from a particular cause?
Line Charts
• Show movement, trends, and comparisons.
• For example, which age group has a higher death rate?
• Or, is a particular rate changing (up or down) over time?
Pie Charts
• Show parts of a whole, a quick overall comparison.
• For example, what proportion of deaths occur in males?
• Or, what proportion of births are to teenage moms?
Maps are a special kind of graphical data display, to show geographic differences in rates and counts. VitalPro makes attractive maps, in PNG, PDF, SVG and GIS formats.
The automatically produced charts and maps can be extensively customized, as explained in this chapter.
7-1: Bar Chart Coloring
• Background color behind the chart.
• Color palette to use for the bars.
• First color in palette to use for bars.
Below are shown the settings, with examples:
|
Background Color for Chart (20 options) 
White 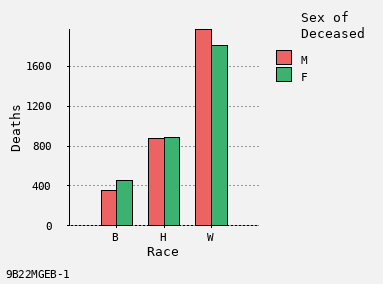
Grey 95 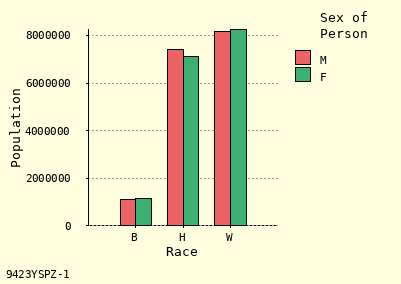
Lemon Chiffon 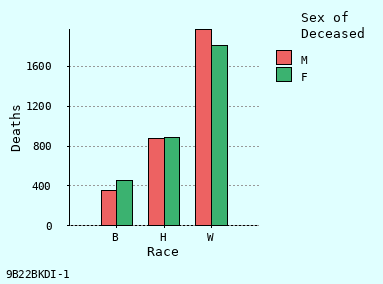
Light Cyan |
|
Color Palette for Bars (4 options) 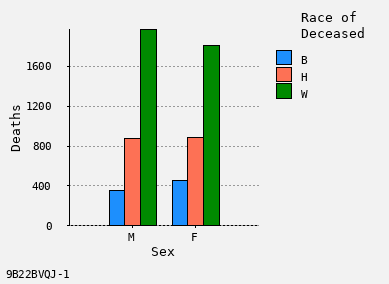
Bright Colors 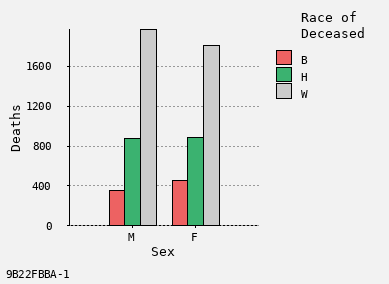
Subdued Colors 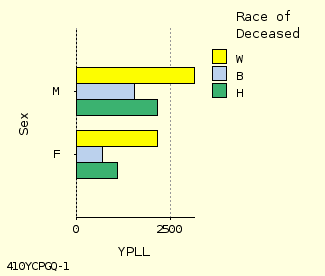
Bright + Subdued 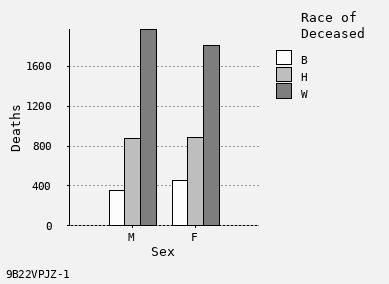
Black + White |
|
First Color in Palette to Use (10 options) 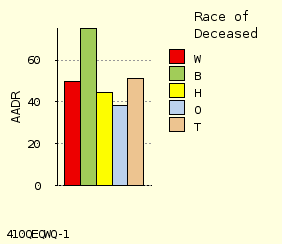
A Forward 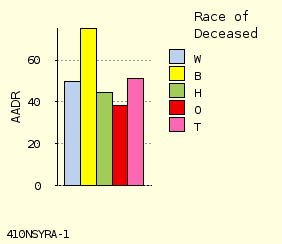
D Reverse 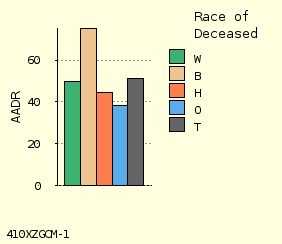
E Forward 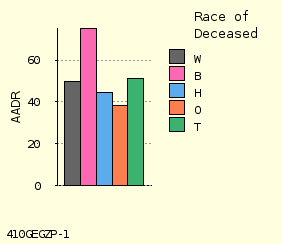
J Reverse |
7-2: Bar Chart Layout
|
Vertical or Horizontal Bars 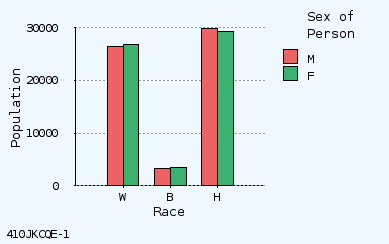
Vertical Bars 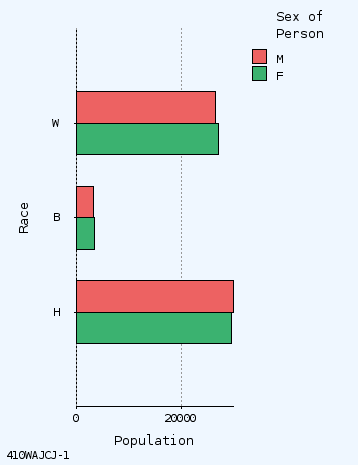
Horizontal Stacked Bars? 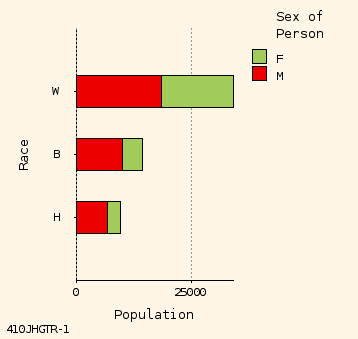
Stacked Bars 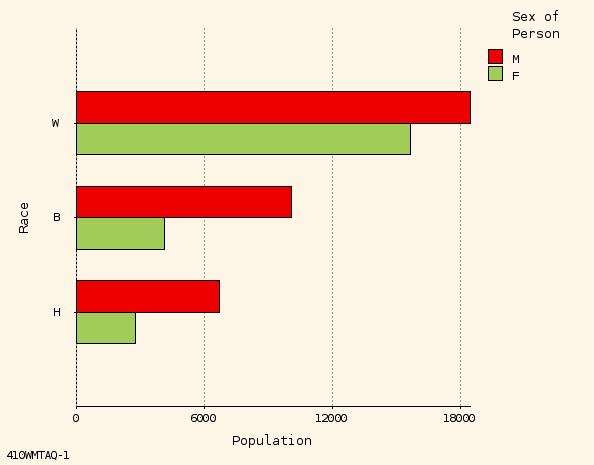
Not Stacked |
|
Height of Each Bar (9 options) 
2 cm High
4 cm High Width of Each Bar (8 options) 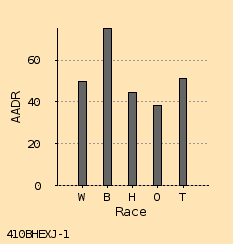
0.2 cm Wide 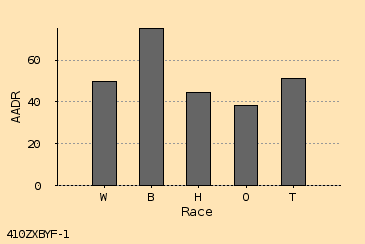
0.6 cm Wide |
|
Include Grid Lines? 
Include Grid 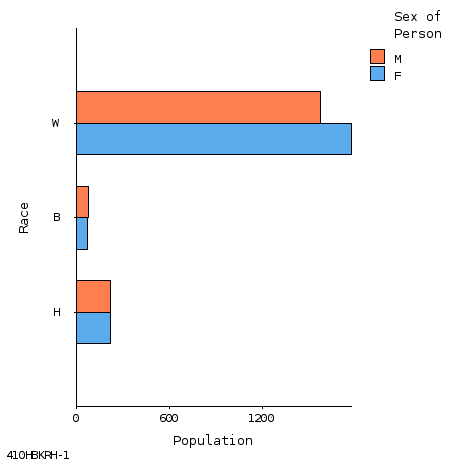
Omit Grid Font Size for Chart Text (8 options) 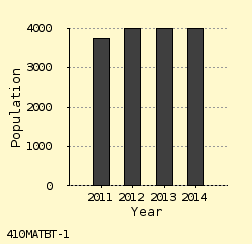
10 pt Font 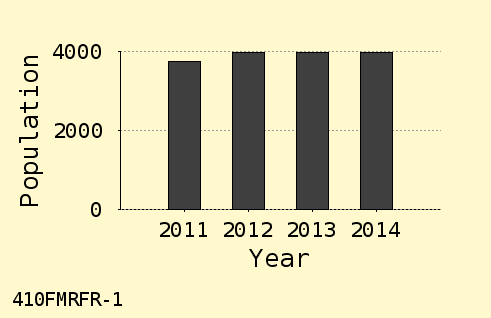
14 pt Font |
7-3: Line Chart Settings #1
Eight ways to customize Vitalnet line charts:
|
Background Color for Chart (20 options) 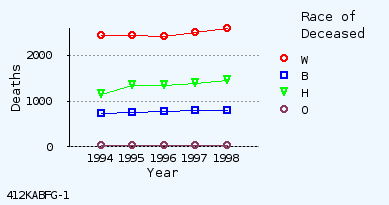
Alice Blue 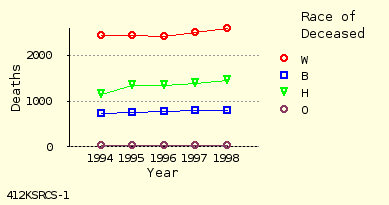
Light Yellow |
|
Include Data Point Symbols? (2 options) 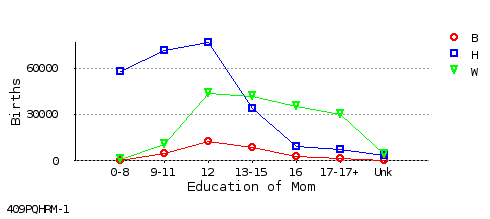
Include Symbols 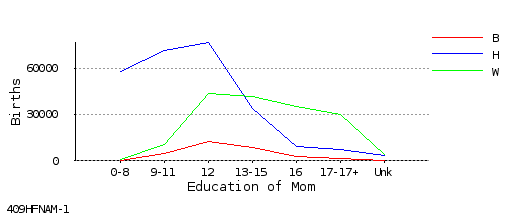
Omit Symbols |
|
Radius for Chart Symbols (10 options) 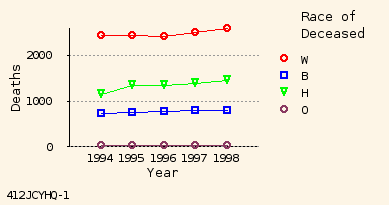
1.0 mm Radius 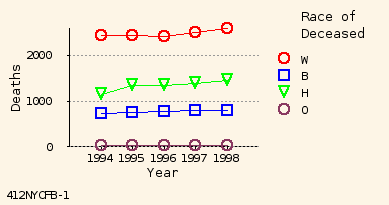
1.4 mm Radius |
|
Line Chart Height (9 options) 4.0 cm (Not Shown) 7.0 cm (Not Shown) |
7-4: Line Chart Settings #2
|
Width of Lines (3 options) 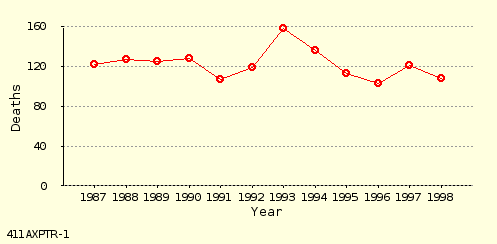
Thin Lines 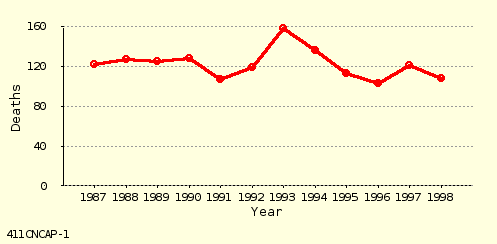
Thick Lines |
|
Include Grid Lines? (2 options) 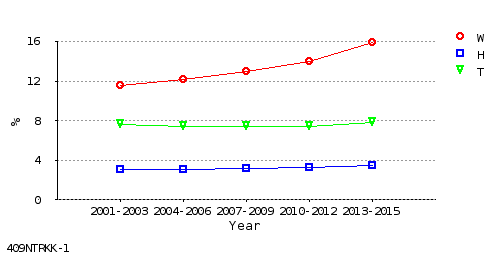
Include Grid 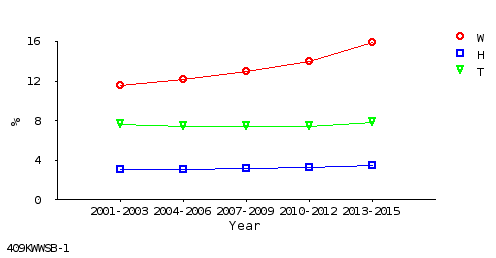
Omit Grid |
|
Colored Lines, or Black + White (2 options) 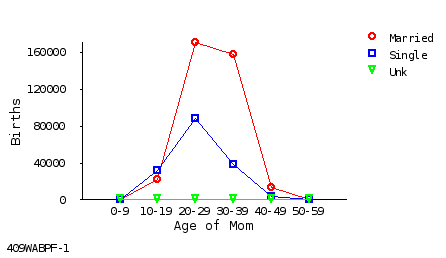
Colored Lines 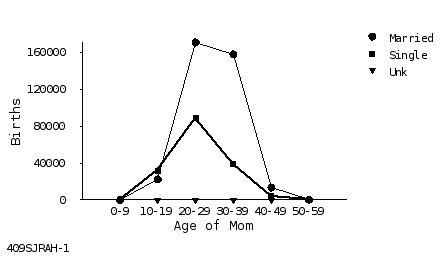
Black + White Lines |
|
Font Size for Chart Text (8 options) 10 pt Font (Not Shown) 12 pt Font (Not Shown) |
7-5: Pie Chart Coloring
Three settings for customizing pie chart coloring:
• The background color behind the chart.
• The color palette to use for the pie chart.
• First color in palette to use (for slice #1).
|
Background Color for Chart (20 options) 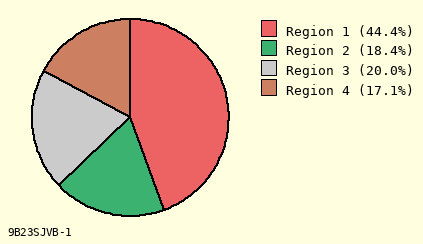
Cornsilk Background 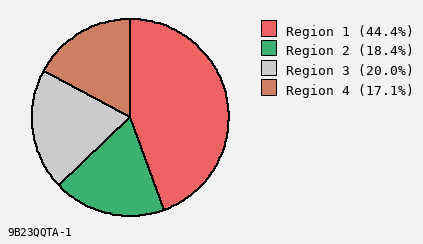
Grey Background 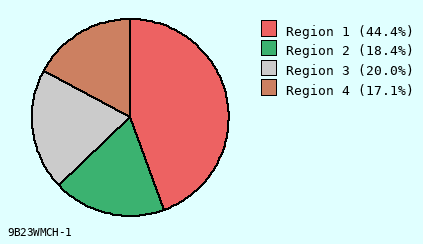
Light Cyan |
|
Color Palette for Pie Chart (3 options) 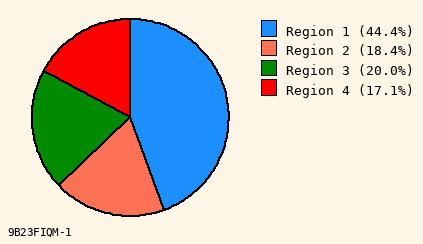
Bright Colors 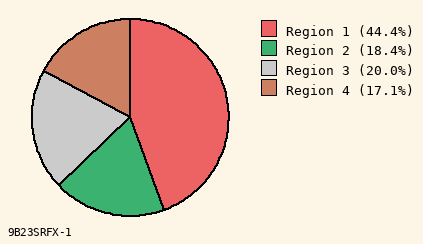
Subdued Colors 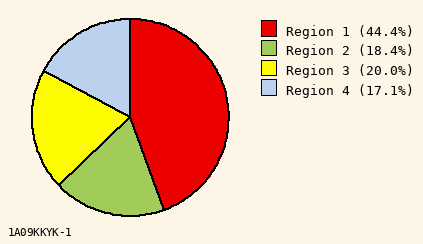
Mixed Colors |
|
Slice #1 Color to Use (10 options) 
Color A for #1 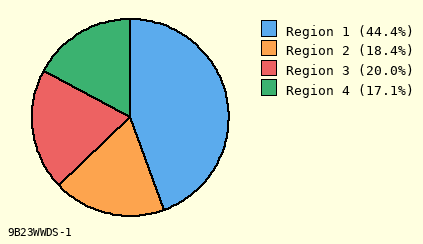
I Forward 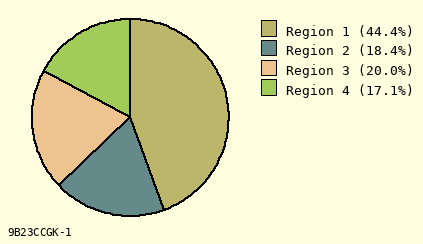
F Reverse |
7-6: More Pie Chart Settings
Four settings for customizing pie chart layout:
|
Slice #1 Clock Position (12 options) 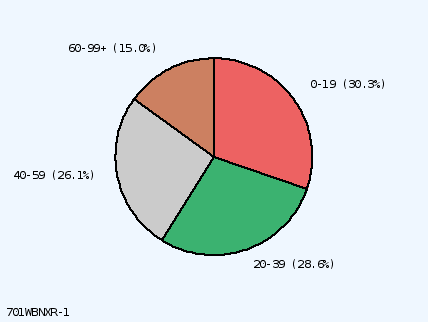
Slice #1 at Noon 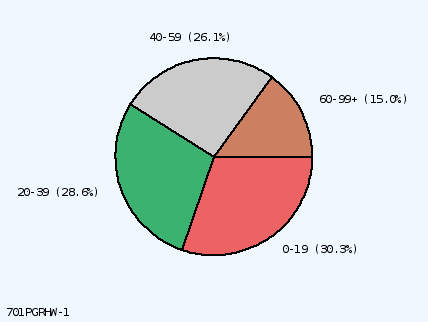
Slice #1 at 3:00 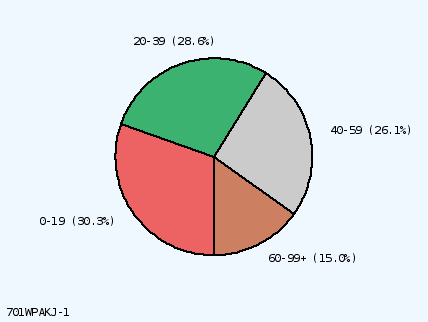
Slice #1 at 6:00 |
|
How to Label Pie Chart (9 options) 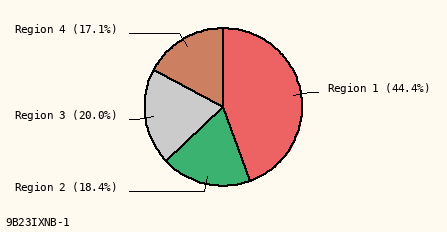
Line + Label 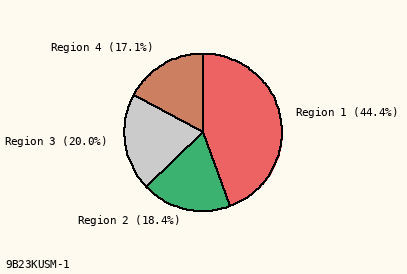
Label Only 
Use Legend |
|
How to Display Slice Percents (3 options) 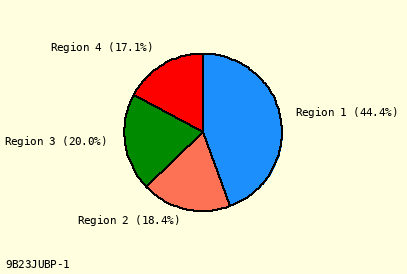
Percent After Label 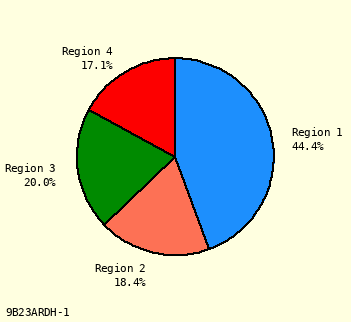
Under Label 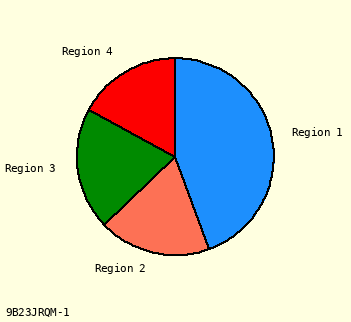
Omit Percents |
|
Pie Chart Radius (9 options) 3.0 cm (Not Shown) 4.0 cm (Not Shown) 5.0 cm (Not Shown) |
7-7: Map Settings #1
|
Color Combination (36 options) 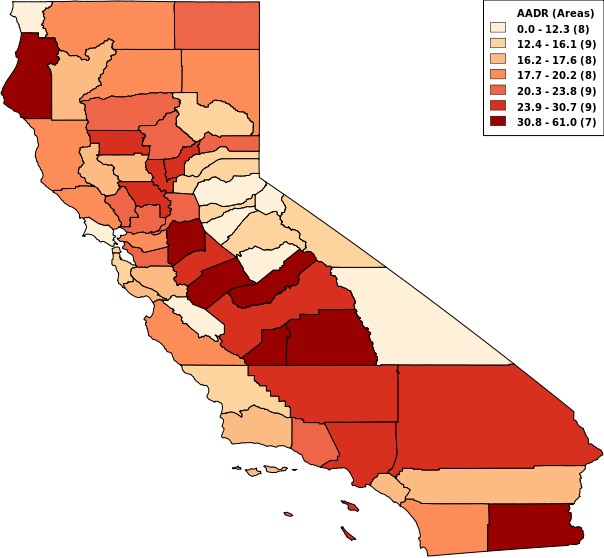
Orange-Red 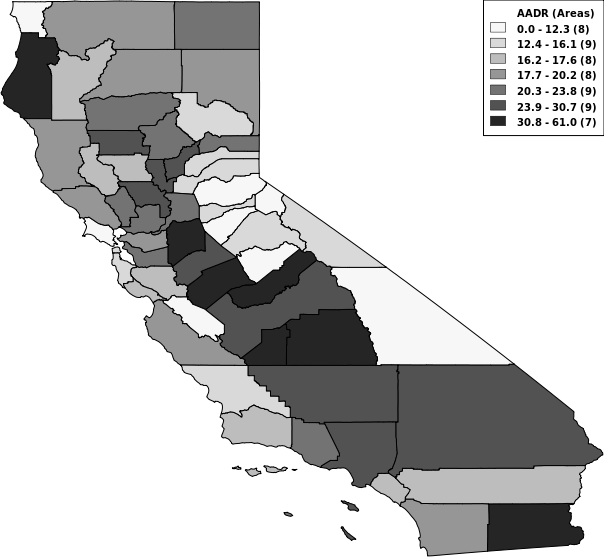
Grey 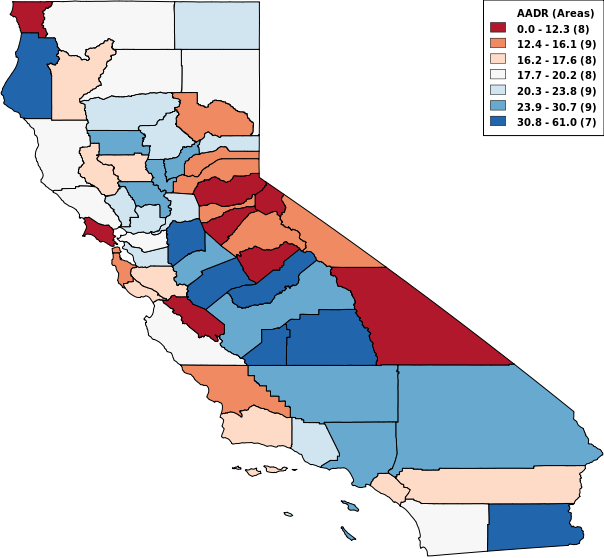
Red-Blue |
|
Number of Colors (8 options) 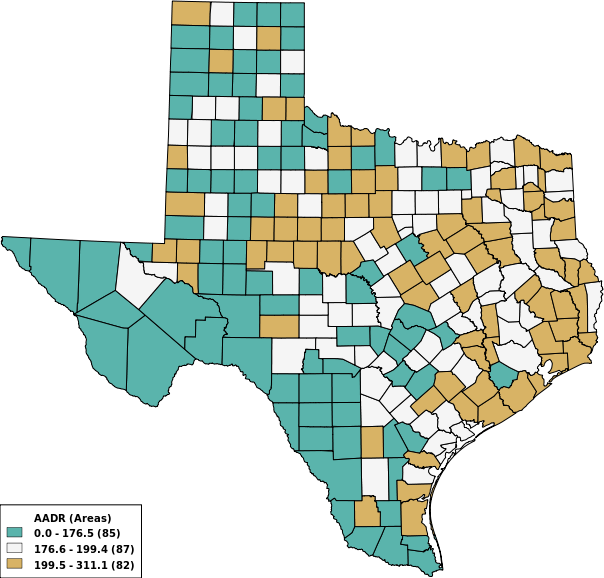
3 Colors 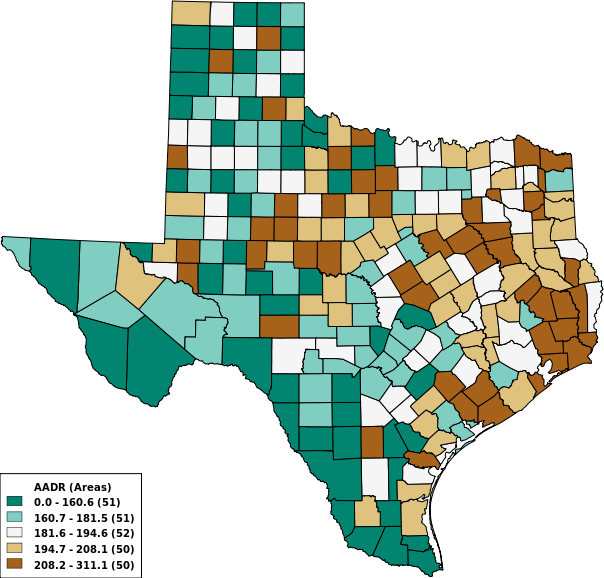
5 Colors 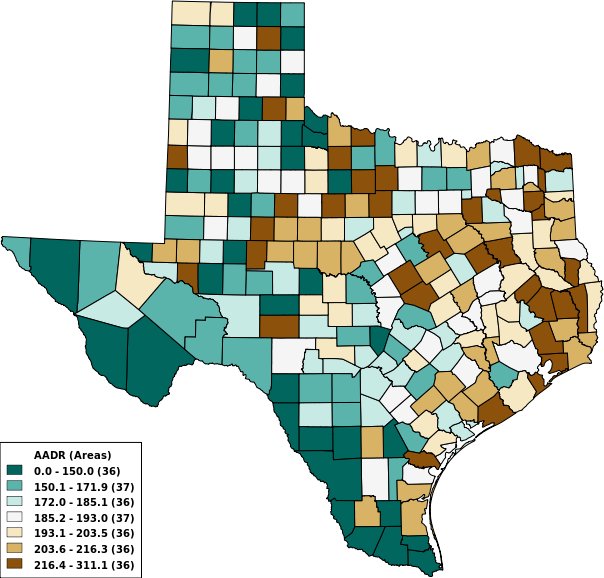
7 Colors |
|
How to Set Ranges (3 options) 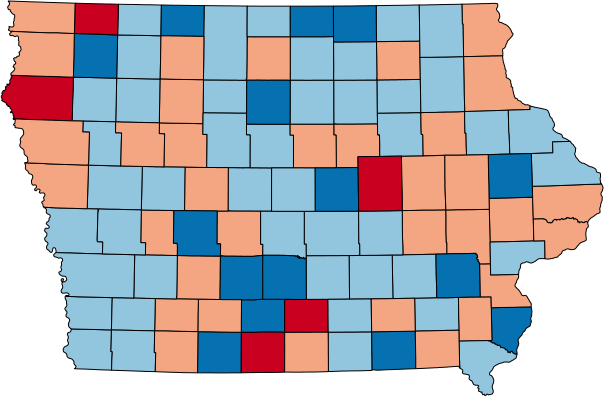
Equal Ranges 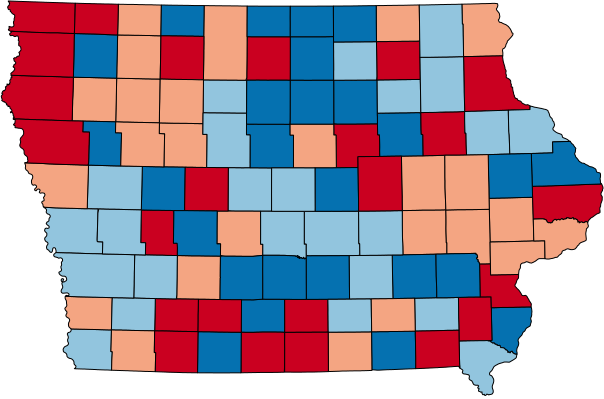
Equal Counts 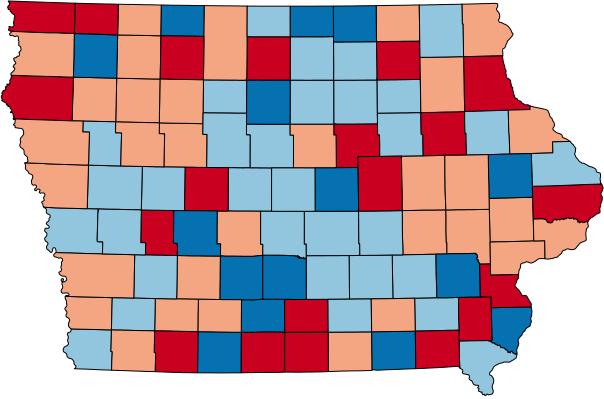
Natural Breaks |
7-8: Map Settings #2
|
Boundaries to Display (6 options) 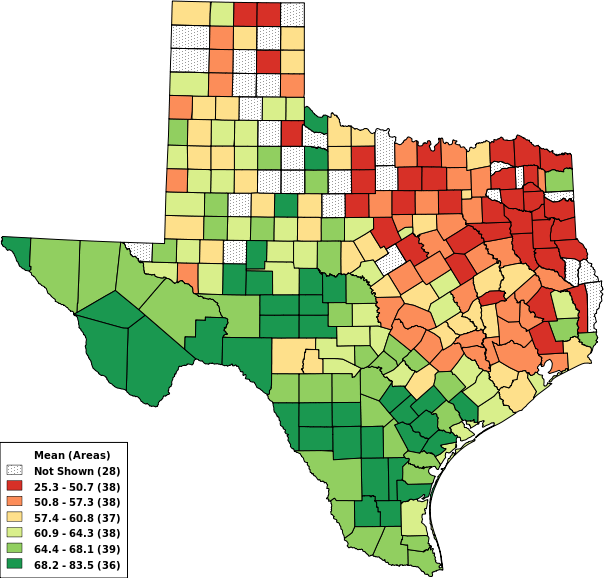
County Boundaries 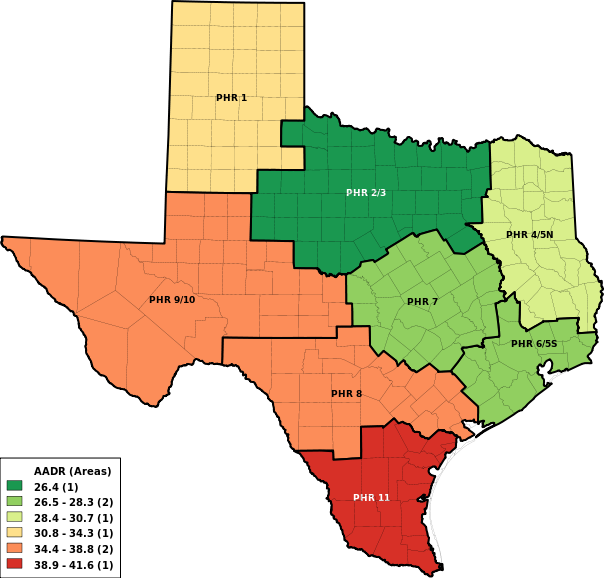
HSR Boundaries 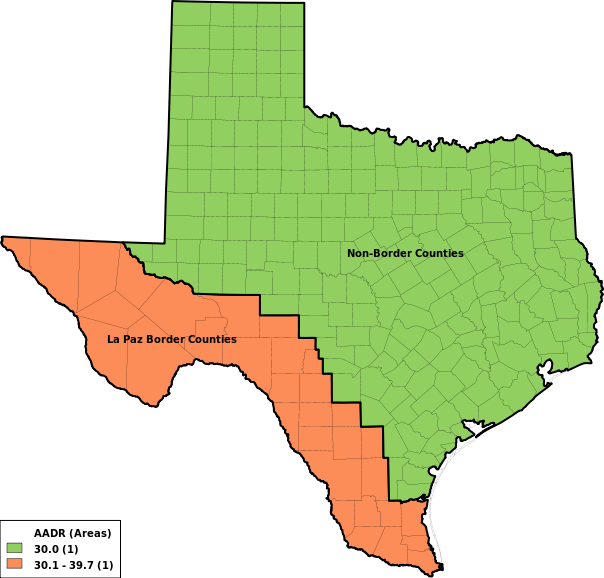
Border Counties |
|
Cell Suppression (0 options) 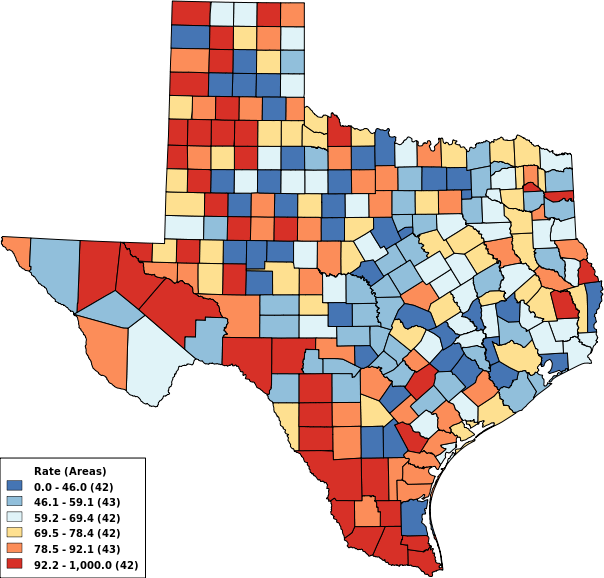
Suppression Off 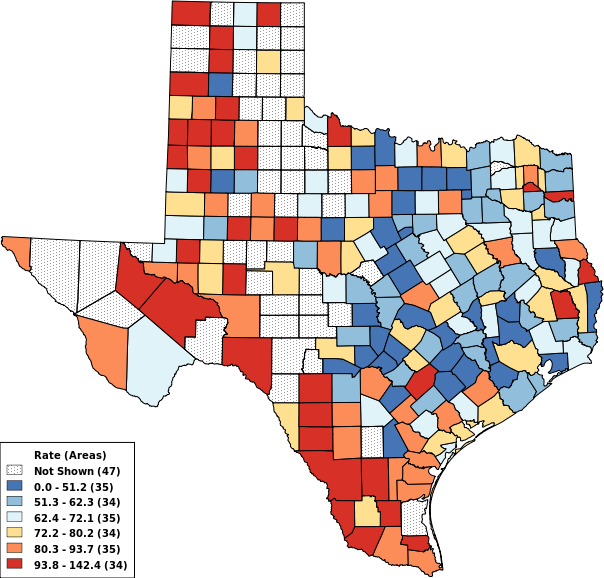
Suppress if < 10 Events 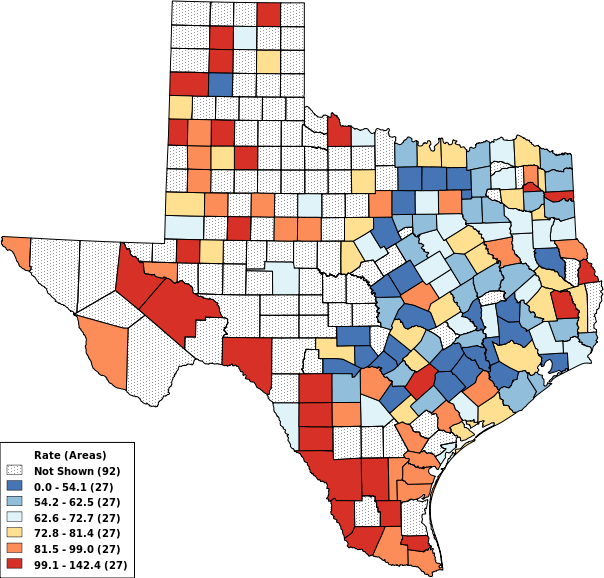
Suppress if < 30 Events |
|
Map File Format (PNG, PDF, SVG, GIS) 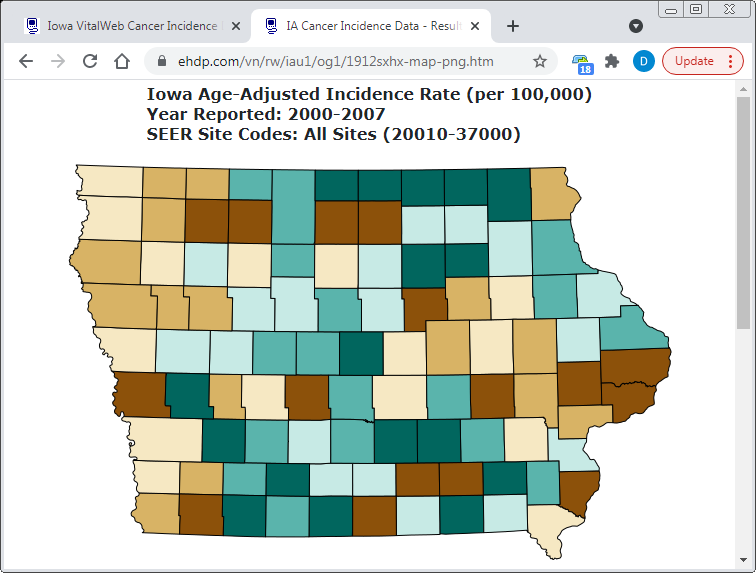
PNG Map (Imports Best) 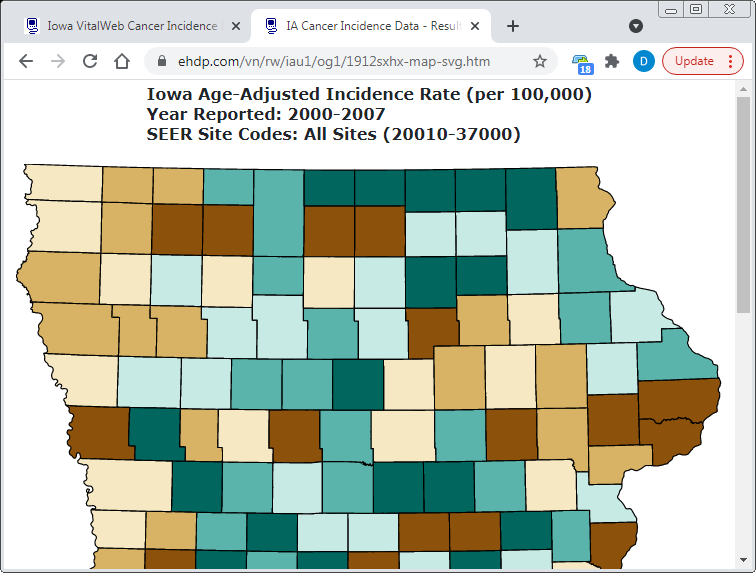
SVG Map (Prints Best) 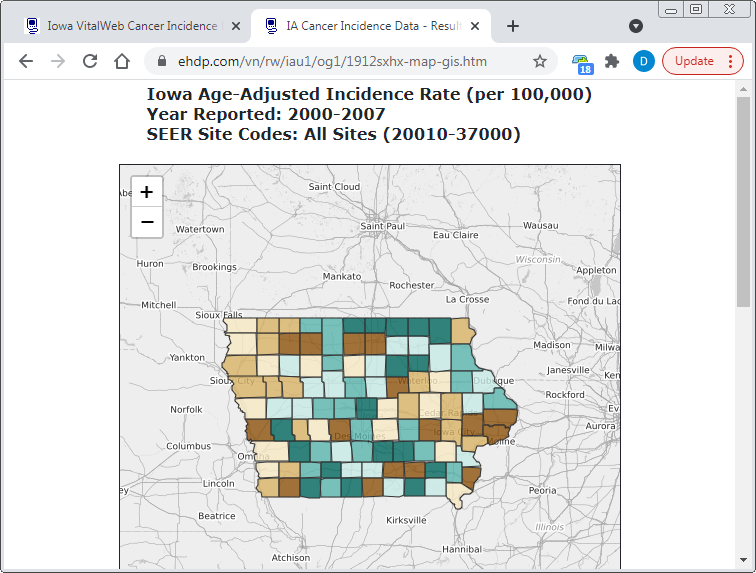
GIS Map (Interesting) |
7-9: Map Settings #3
Color Palettes - VitalPro uses 36 beautiful map color palettes. The palettes have been proven through published research, and used in professional atlases. Trying to hand-pick colors is tedious, and usually produces bad-looking results. VitalPro color palettes save lots of time and guarantee successful results.
| 1 | 2 | 3 | 4 | 5 | 6 | 7 | 8 | 9 | Diverging Palette | BW | CB |
| Brown-BlueGreen | - | Y | |||||||||
| Pink-Green | - | Y | |||||||||
| Purple-Green | - | Y | |||||||||
| Purple-Orange | Y | Y | |||||||||
| Red-Blue | - | Y | |||||||||
| Red-Grey | - | - | |||||||||
| Red-Yellow-Blue | - | Y | |||||||||
| Red-Yellow-Green | - | - | |||||||||
| Spectral | Y | - | |||||||||
| 1 | 2 | 3 | 4 | 5 | 6 | 7 | 8 | 9 | Sequential Palette | BW | CB |
| Blue | Y | Y | |||||||||
| Blue-Green | Y | Y | |||||||||
| Blue-Purple | Y | Y | |||||||||
| Green-Blue | Y | Y | |||||||||
| Green | Y | Y | |||||||||
| Grey | Y | Y | |||||||||
| Orange | Y | Y | |||||||||
| Orange-Red | Y | Y | |||||||||
| Purple-Blue | Y | Y | |||||||||
| Purple-Green | Y | Y | |||||||||
| Purple-Red | Y | Y | |||||||||
| Purple | Y | Y | |||||||||
| Red-Purple | Y | Y | |||||||||
| Red | Y | Y | |||||||||
| Yellow-Green | Y | Y | |||||||||
| Yellow-Blue | Y | Y | |||||||||
| Yellow-Brown | Y | Y | |||||||||
| Yellow-Red | Y | Y |
All palettes are OK for color printing. BW - OK for black and white printing? CB - OK for red-green color blindness?
Text Font for Map - 9 font options for displaying area labels: [Serif Normal] [Sans-Serif Normal] [Monospace Normal] [Serif Bold] [Sans-Serif Bold] [Monospace Bold] [Serif Italic] [Sans-Serif Italic] [Monospace Italic]
Time Trend Maps - Vitalnet can make a series of maps, one for each selected year range. The map series is cycled within a special interface. The data ranges are the same for each map in the series.
7-10: Smart Output
Vitalnet is smart about making output. Whenever you make a table, Vitalnet usually makes one or more accompanying charts. But it only produces the charts that make sense. If a chart would look terrible, or not be epidemiologically valid, the software does not make it.
Vitalnet avoids making misleading or useless charts. To prevent misinterpretation and embarassing results, Vitalnet intelligently decides when it appropriate to make a chart, as explained below:
Bar charts are only made if the following conditions are met:
• 1 to 20 rows (groups of bars).
• 1 to 10 columns (bars per group).
• No suppressed results (for stacked bar chart).
Line charts are only made if the following conditions are met:
• Range rows (such as age or year).
• No breaks in ranges (not 2000, 2002).
• Rows not sorted. No suppressed results.
• No more than 10 lines (10 columns).
Pie charts are only made if the following conditions are met:
• Cumulative data (counts, some rates).
• One set of numbers (one row or column).
• 2 to 9 pie slices. No suppressed results.
Time trend maps (that cycle from map to map) are only produced when all selected year ranges are the same width. For example, 1995-1996, 1997-1998, 1999-2000 is OK. But 1995-1996, 1997-1998, 1999 is not OK. Also, at least two year ranges are required. So if you just have 1995-1996 (a single range) selected, Vitalnet does not make a series of time trend maps.
Time trend analysis, when making a table with year rows, is only carried out when: 1) at least three year ranges are selected, 2) there are no gaps in the ranges, 3) the ranges are the same width, and 4) the rows are not sorted. When these conditions are met, the time trend analysis is epidemiologically valid.
Chapter 8: Other Parameters
What's in this chapter - This chapter explains various other parameters, that are neither table variables nor data variables.
Out of the many other parameters, ere are the ones covered in this chapter:
• Decimal Digits
• Trend Confidence
• CSV/TSV and DBF Output
There are some other parameters not specifically covered in this manual. For example, you can tell VitalPro to include or not include a unique ID on the output. These additional parameters are self-explanatory, and are usually kept at the default value anyway.
8-1: Decimal Places
VitalPro allows specification of the number of decimal places in your results. For example, the number 64.29 has two decimal places. The number 64 has zero decimal places.
8-2: Trend Analysis
· VitalPro automatically carries out trend analyses.
Purpose of trend analysis - When analyzing data with a year (or year range) for each row, you usually want to know: Is there a trend up or down? Is the rate increasing or decreasing?
When trend analysis is done - Trends are calculated if: (1) the "row variable" is year, (2) rows are not sorted, (3) at least three year groupings, (4) and year groupings have equal ranges, for example 2000-2001, 2002-2003, 2004-2005. Another example of equal ranges is 2010, 2011, 2012.
Least-squares line shows the trend - VitalPro carries out a "least-squares" analysis for the time series. This finds the best straight line to describe the data for each data column. The line is defined by the value for the first year ("y-intercept"), and the amount of change per year range ("slope").
Confidence intervals show if significant trend - VitalPro calculates a confidence interval for the slope. If the confidence interval doesn't include 0, there is a significant trend.
Population Tabulated by Year and Sex Place of Residence: Texas Year Male Female Total ---------------------------------------------------- 1995-1997 28,369,279 28,922,310 57,291,589 1998-2000 29,726,292 30,373,548 60,099,840 2001-2003 31,240,811 31,934,698 63,175,509 ---------------------------------------------------- Total 89,336,382 91,230,556 180,566,938 Horizontal Bar Graphs (X = 2,128,980 Population, x = 1,064,490): Year Male Female -------------------------------------------- 1995-1997 XXXXXXXXXXXXXx XXXXXXXXXXXXXx 1998-2000 XXXXXXXXXXXXXX XXXXXXXXXXXXXXx 2001-2003 XXXXXXXXXXXXXXx XXXXXXXXXXXXXXX -------------------------------------------- Detailed Least-Squares Analysis, to Detect Linear Trend: Column 1995-1997 Y-intercept Slope 95% CI (1 df, t=12.706) ---------------------------------------------------------------------------- Male 28,343,028 +1,435,766 +858049 to +2013483 ** Female 28,903,991 +1,506,194 +1103047 to +1909341 ** Total 57,247,019 +2,941,960 +1961096 to +3922824 ** ---------------------------------------------------------------------------- Y-intercept and slope may be used to draw least-squares line. If confidence interval (CI) does not include 0, trend is significant [**]. |
Significant Upward Trends
8-3: TXT, CSV, DBF Output
· Results may be saved to a text, spreadsheet, or database file.
Saving to a second format - The output in your desktop browser always includes (at the bottom of the output) links to ASCII text (txt), spreadsheet (csv, tsv, or dif), and dBASE III (dbf) output. To view or download one of the second formats, simply click on the appropriate link, such as "dBASE III".
TXT file - Text output is pure ASCII text, for example as shown on the previous page.
CSV file - CSV (comma-separated-value) output has a comma between each output item, and each output text item is surrounded by "double quotes", as shown below. CSV format is ideal for importing into spreadsheet software, such as Excel. TSV (tab-separated-value) format is similar, but uses tabs instead of commas between items.
Browser differences - Internet Explorer automatically displays CSV output in Excel (if installed). Other browsers may be configured to automatically display CSV output in a spreadsheet program. Or you may need to right-click on the link, and select "Open" to open the file.
"Population" "Tabulated by Race-Ethnicity and Sex" "Years: 1990" "Place of Residence: PHR 1" "Race","Male","Female","Total" "--------------------" "White",250520,269745,520265 "Black",17348,18589,35937 "Hispanic",85674,82065,167739 "Other",5259,4938,10197 "--------------------" "Total",358801,375337,734138 "Analysis Footnotes:" "Unique ID, for Keeping Track of Analyses: 414YARTW" "Output Produced: Sat Apr 14 10:41:02 2001, by Texas VitalNet" "Population Data Source (Pre-1990): TDH State Health Data (1/95)" "Population Data Source (1990+): TAMU TX State Data Center (8/98)" |
Example of CSV Output
DBF file - Results may also be saved to a dBASE III database file (dbf extension). DBF files are excellent for importing into almost any data analysis, graphics, spreadsheet, mapping or other presentation software. Field names are automatically imported along with the data. Suppressed cells are represented by the number "-1".
DBF file limitations - (1) Header and footer information listing analysis parameters cannot be included in DBF files. To help out, you may want to make the name of the dBASE file the same as the table ID, such as "405MFAQB.DBF" so you can refer to the table later. (2) Only 128 columns may be saved to a dBASE III file. This rarely presents a problem, because unlimited rows are allowed.
Glossary
Area set - One or more areas combined.
ASCII file - A text file, with only alphabetical, numerical, and punctuation characters, like you would see in normal text. Vitalnet can produce output in ASCII format.
CDC - Centers for Disease Control and Prevention. US federal health agency.
Cell - A space for a single numerical result in a table, at a row-column intersection.
Cell suppression - An asterisk "*" is placed in cells with fewer events (such as deaths) than a limit set by the user. Row / column totals with exactly one suppressed cell in the row / column are also suppressed. If more than one cell in the row / column is suppressed, the row / column total may be displayed.
Columns - Vertical groupings of data in a Vitalnet table, such as a column for each race group.
CSV format - Comma-separated-value format. CSV files are readily imported into spreadsheet software. Each output item is separated by a comma from surrounding items, and each output text item is surrounded by "double quotes". A comma-separated-value file has "csv" extension. Similar to TSV format.
Data warehouse - A software system, such as Vitalnet, making large complex databases readily available for querying and analysis. A related term is "data mining", finding unexpected relationships in a data set, for further study. Data mining is similar to exploratory data analysis. Vitalnet is excellent at data mining. Of course, keep in mind that the more you look, the more unusual events you will find, just by chance.
dBASE III format - A widely used file format originally for the database software of the same name. Files in dBASE III format may be readily imported into almost any data analysis, graphing, mapping, or other presentation software. Uses dbf extension. Suppressed cells are represented as the number "-1".
DIF format - Data interchange format. DIF files are readily imported into spreadsheet software. The DIF format is too complex to explain in this glossary. Has "dif" extension.
Denominator - The number on the bottom of a fraction. Population data are often referred to as "denominator data", as they are used as denominators to calculate population-based rates.
Export - Produce output that can be read into other computer programs. Vitalnet produces ASCII text (txt), comma-separated-value (csv), HTML (htm), and dBASE III (dbf) files for export.
Filter variable - A variable solely used to filter which records are included in the output. For example, for a single table with race rows and sex columns, age 10-19 is a filter variable.
FIPS Code - FIPS = "Federal Information Processing Standards". A five-digit number which uniquely identifies counties, territories, and certain other areas in the United States. States have two-digit FIPS codes.
Footer - Last part of a Vitalnet table. Lists less important details of the analysis, such as the date produced, and data sources. Also contains a unique ID to assist in keeping track of analyses.
Header - First part of a Vitalnet table. Lists key analysis parameters, such as years analyzed.
Import - Read information into a computer program. ASCII text, CSV, TSV, DIF, HTML, and dBASE III files from Vitalnet are easily imported into word processing, spreadsheet, data analysis, mapping, graphing, and other presentation software programs.
Least-squares - A standard method for fitting the best straight line to a set of points. Produces a Y-intercept and a slope defining the least-squares line.
Median population age - A measure of the overall age of a population. Half the population is younger than the median, half is older. Assuming a population of 100,000 people, 50,000 people would be older than the median age, 50,000 younger.
Multiple age groups - One age group for each table row (or column). Example: 0-19, 20-59, 60-99+.
Natural Breaks - Method for determining map ranges. Minimizes "squared deviations from class means".
NCHS - National Center for Health Statistics. US health statistics agency. Part of the CDC.
Percent total population in age group - A population statistic. Useful for assessing the relative age of the population. If the total population is 100,000, and 8,000 are under age 10, the percent of the total population under 10 is 8 percent.
Population - The number of people living in an area.
Rows - Horizontal lines in a Vitalnet table, such as a row for each race group.
Row sort settings - Vitalnet rows may be sorted in ascending or descending order.
Set - A combination of one or more things. For example, several areas may be combined into an area set.
Single age group - Only one age group (30-49, for example) is selected. A single age group is used for tables that do not have age columns or age rows.
Statistic (Main Statistic) - The basic type of numerical result displayed in a table, chart, or map. For example, birth rate, death rate, population, pregnancy rate, etc.
Table - A set of results produced by Vitalnet. A table has several parts:
1. Header - basic analysis settings
2. Data section - numerical results
3. Bar graphs - horizontal charts
4. Footer - other analysis settings
Tabular chart - A section of a Vitalnet table. Gives an scaleable graphical representation of the data. May be omitted from the output table.
TSV format - Tab-separated-value format. TSV files are readily imported into spreadsheet software. Each output item is separated by a tab from surrounding items, and each output text item is surrounded by "double quotes". A tab-separated-value file has "tsv" extension. Similar to CSV format.
Vitalnet / VitalPro / VitalWeb - Vitalnet is data warehouse / data analysis software for analyzing health data sets. VitalPro is a Vitalnet system that runs directly on a PC, for example VitalPro for Win32. VitalWeb is a Vitalnet system that runs over the internet, for example VitalWeb Ajax.
Windows - Microsoft PC operating systems. VitalPro runs under any version of Windows.
World Wide Web (WWW) - A widely used part of the internet that may be easily accessed with a web browser. Vitalnet runs on the WWW.