VitalPro - Desktop Platform
Runs on Windows PC.
Maximum analytical flexibility.

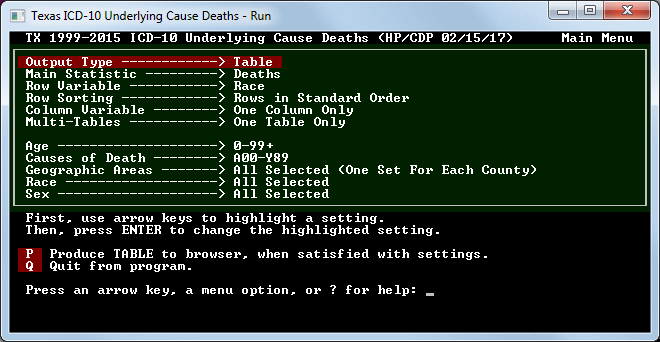
VitalPro - Main Menu
| · Main Menu lists all settings. · Easy to see everything. · Easy to access submenus. |
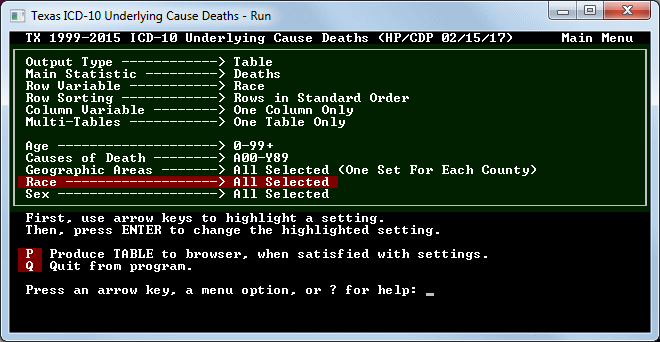
VitalPro - Navigating Menus
| · Navigate using arrow keys. · Highlight setting. Press ENTER. · Program displays setting submenu. |
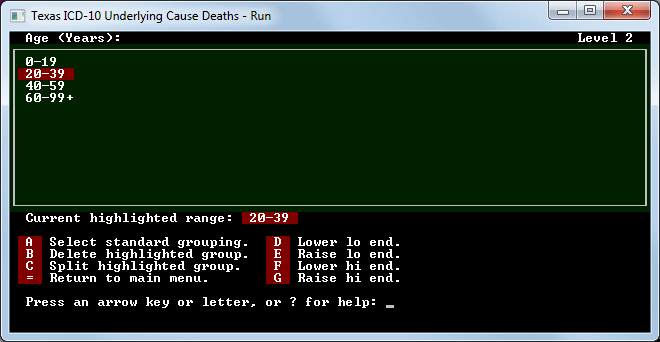
VitalPro - Age Submenu
| · Select grouping (like 10-year ages). · Extend a range up or down. · Delete or split a range. |
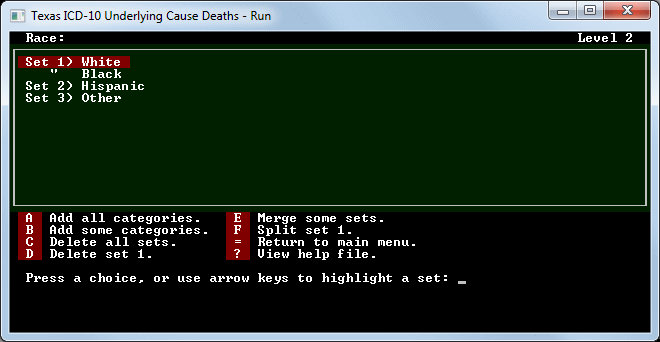
VitalPro - Race Submenu
| · Easily add races (as sets). · Merge sets into new set. · Delete / split sets as needed. |
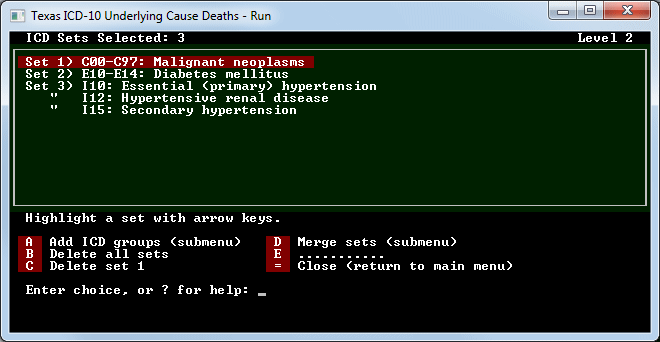
VitalPro - ICD Set Submenu
| · Any ICD groups can be analyzed. · Merge ICD sets into new set. · Delete / split sets as needed. |
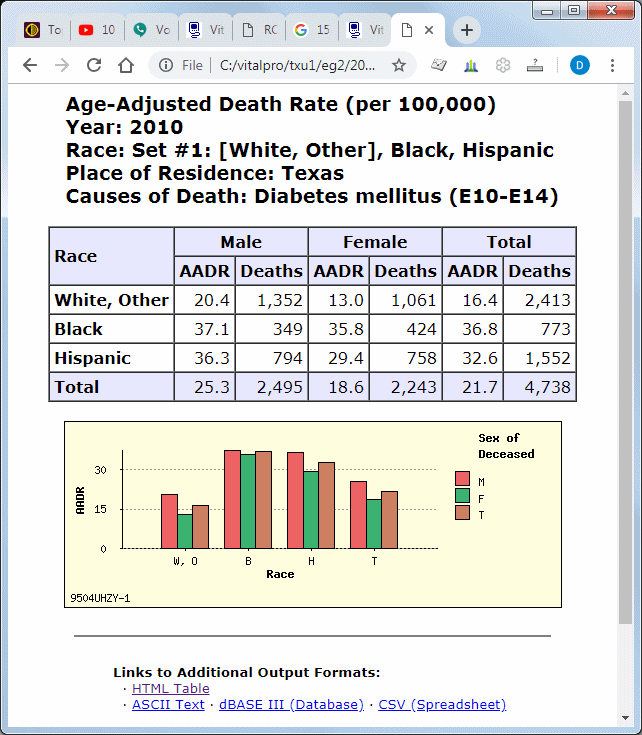
VitalPro - Output Table
| · Press 'P' to produce table. · Use browser to view the output. · After viewing, click on the program. |

VitalPro - Switch Output Type
| · Press ENTER on "Output Type". · On submenu, select "Maps". · Program switches to designing maps. |
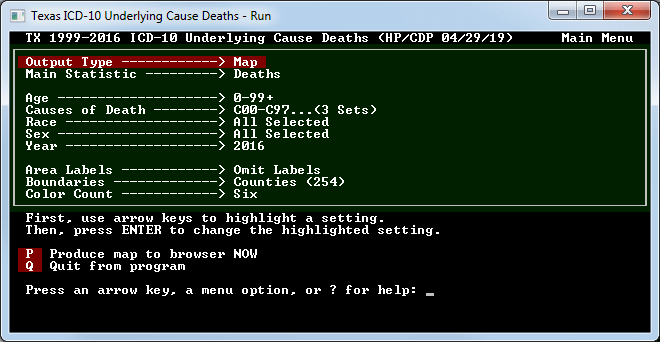
VitalPro - Designing a Map
| · Menu optimizes for designing maps. · Table options (eg, rows) not shown. · Map options (eg, colors) are shown. |
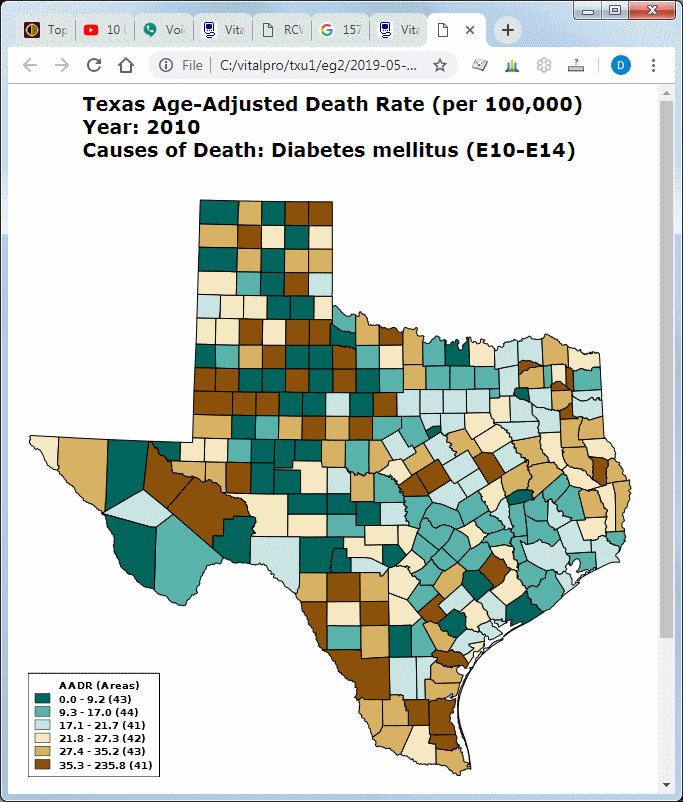
VitalPro - Output Map
| · Press 'P' Menu to produce map. · Use your browser to view the map. · After viewing, click on the program. |

Your Desktop Data Warehouse
| · Full analytic flexibility. · Fast and easy-to-use. · Publication-ready output. |