Vitalnet Map Examples
Vitalnet maps show geographic trends, in PNG, PDF, SVG and GIS formats. Vitalnet allows you to easily customize your map in many different ways, to best communicate the results.
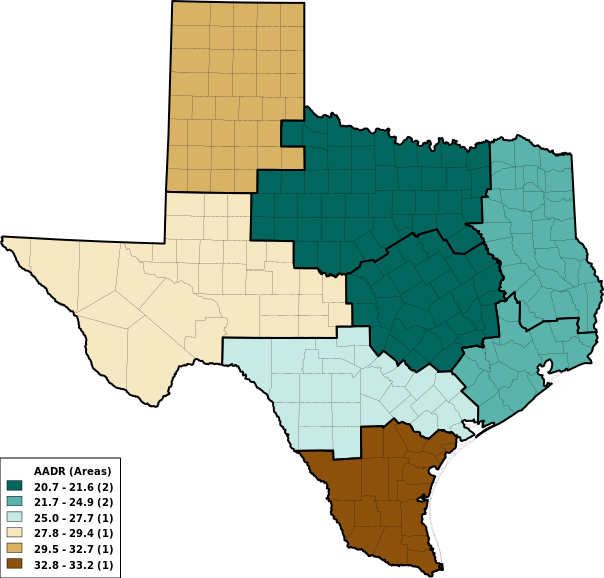
Use labels?
Omit labels.
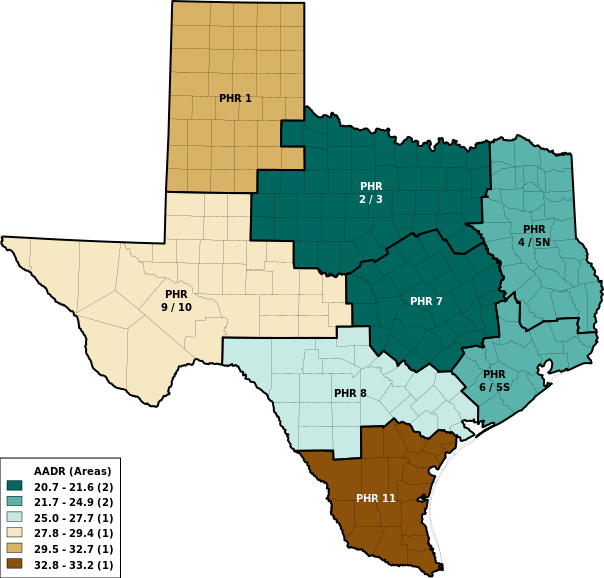
Use labels?
Include labels.
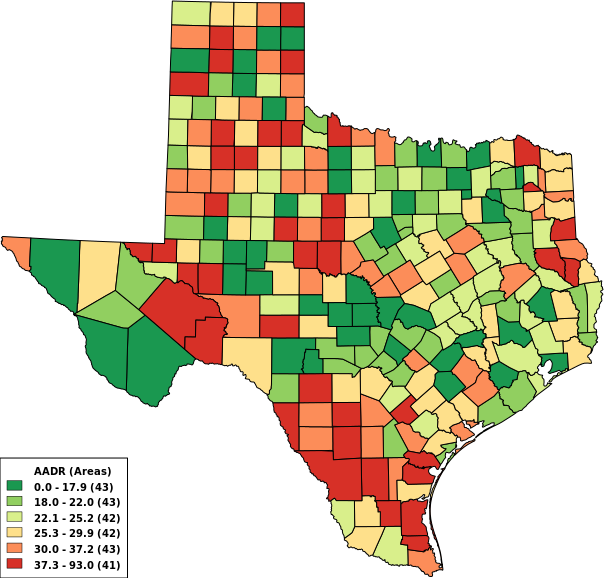
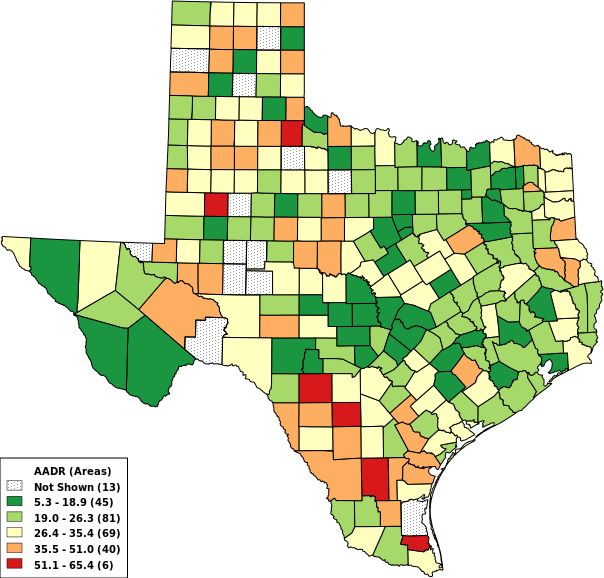
Choose boundaries
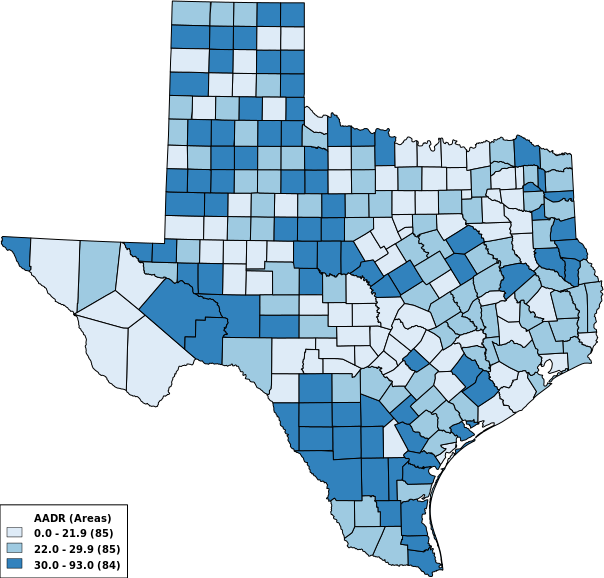
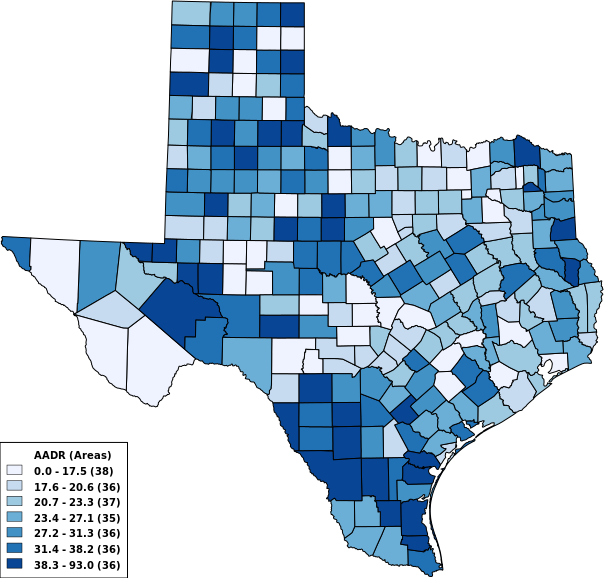
County boundaries.
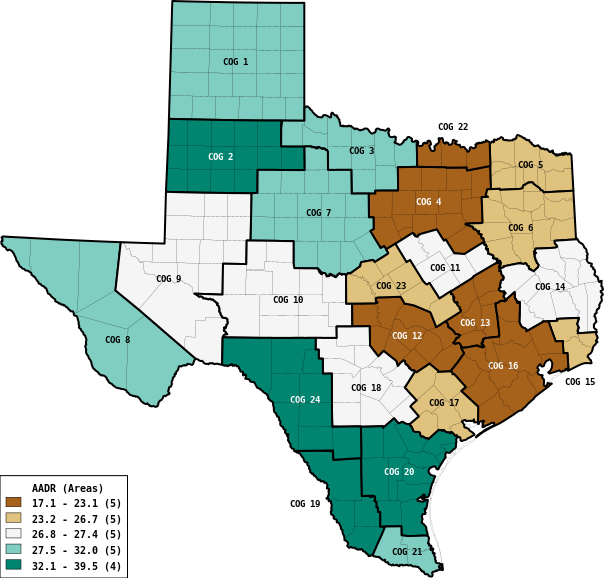
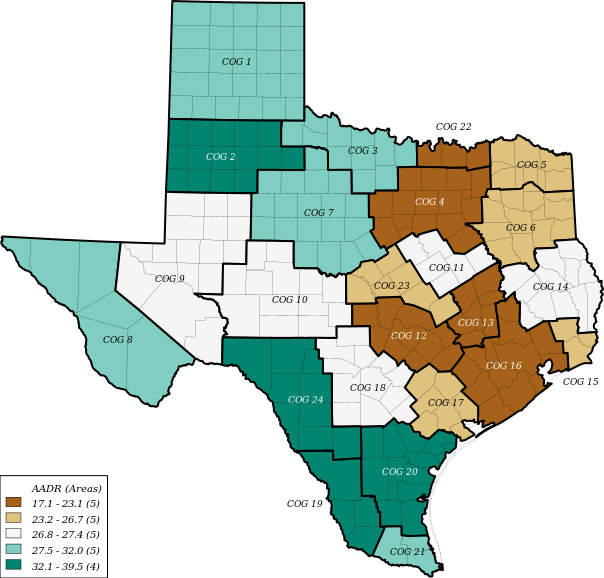
Choose boundaries
PHR boundaries.
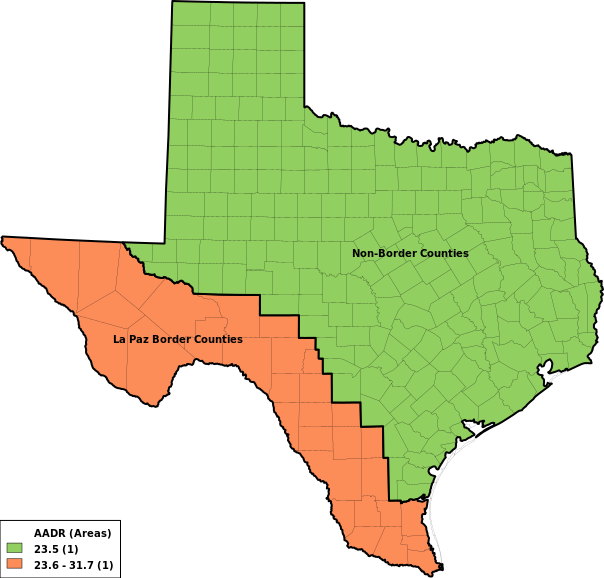
Choose boundaries
Border boundaries.

Suppress low counts?
Cell suppression off.
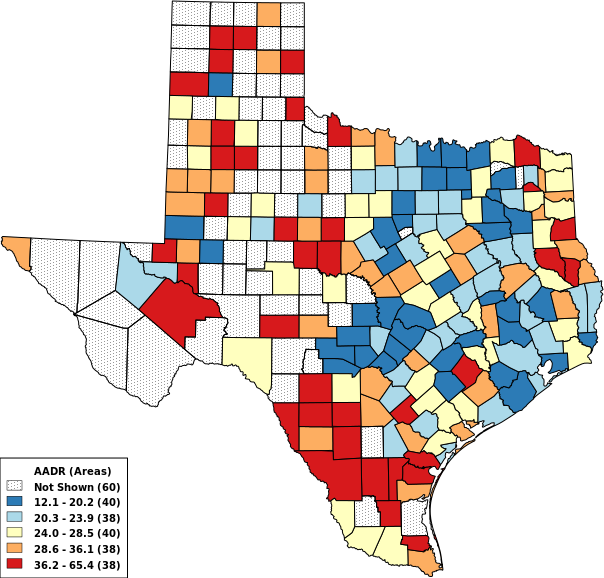
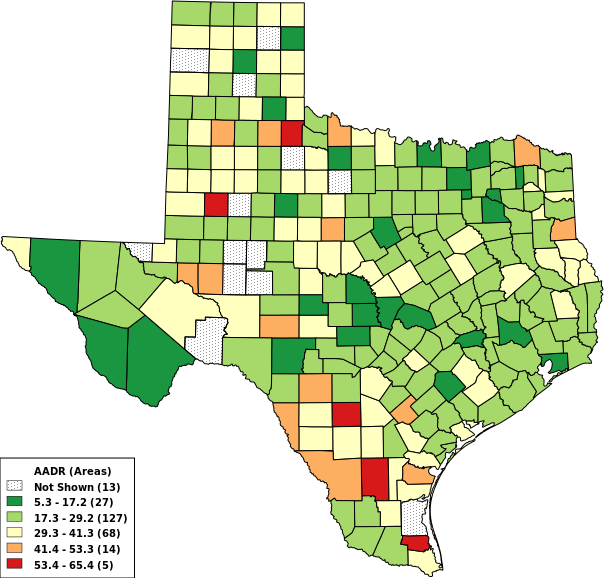
Suppress low counts?
Suppress if < 15 events.
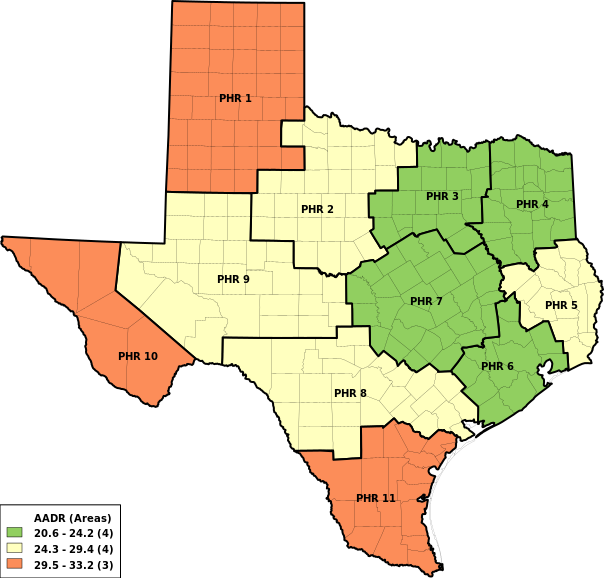
Set number of colors
Three colors.
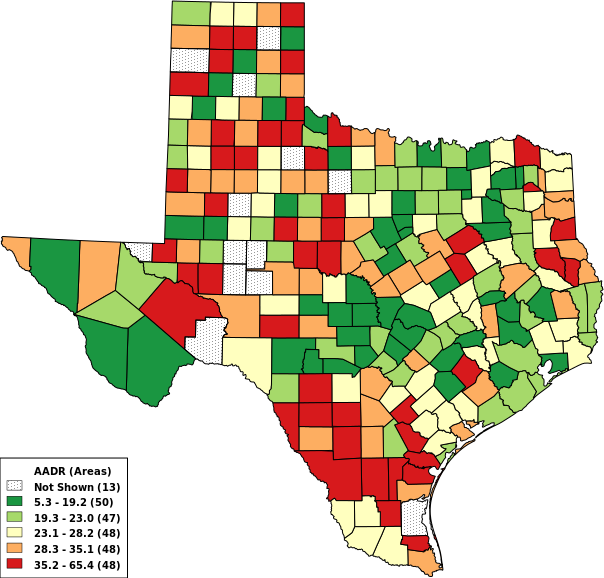
Set number of colors
Five colors.

Choose color palette
Blue palette.
Choose color palette
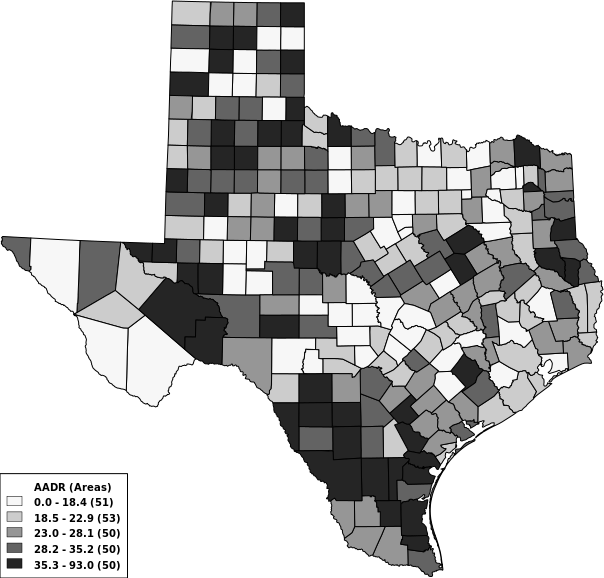
Grey palette.
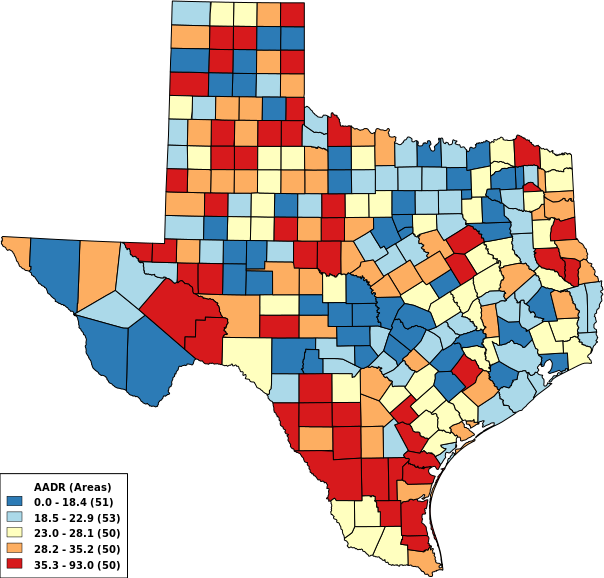
Choose color palette
Blue-Yellow-Red palette.
Choose range type
Equal intervals.
Choose range type
Equal counts.
Choose range type
Natural breaks.
Choose font on map
Monospace Bold.
Choose font on map
Serif Italic.
Examples of Vitalnet map capabilities:
|
Area Labels:
Omit Labels · Include Labels |
|
Boundaries:
County · HSR Regions · Border Counties |
|
Suppress Cells?
Suppress Off · Suppress < 5 · Suppress < 15 |
|
Color Count:
3 Colors · 5 Colors · 7 Colors · 9 Colors |
|
Color Palette:
Blue Scale · Grey Scale · Blue-Yellow-Red |
|
Output Format:
PNG Map · SVG Map · GIS Map · PDF Map |
|
Range Type:
Equal Ranges · Equal Counts · Natural Breaks |
|
Text on Map:
Monospace Bold · Sans-Serif Bold |
|
Time Trend:
Single Map · Map Series |
Online help for Vitalnet Maps
Equal Ranges Explained
Equal Counts Explained
Natural Breaks Explained
Color Palettes Used in Vitalnet
Bar · Line · Pie · Tables · Output Home
As shown in the following picture:

Each output map links to additional formats:
| Format | Main Uses |
|---|---|
| HTML Table | MS Excel or Word |
| PNG Map | MS PPT or Word |
| PDF Map | Adobe Reader |
| GIS Map | Web Browser |
| SVG Map | MS PPT or Word |
| ASCII Text | Microsoft Word |
| dBASE III | GIS or Stats SW |
| CSV Delimited | Microsoft Excel |