Vitalnet Line Chart Examples
Vitalnet line charts show trends, changes, and comparisons. As shown on this page, Vitalnet allows you to easily customize your line chart in many different ways, to best show the results.
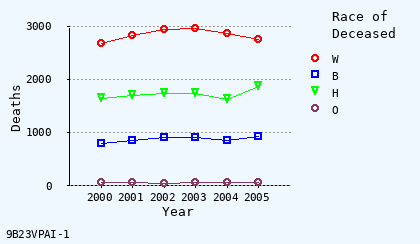
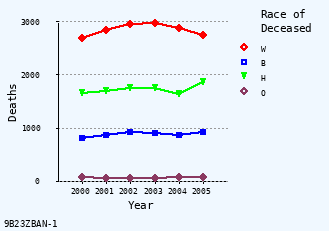
Pick pleasing background
Alice blue is nice.

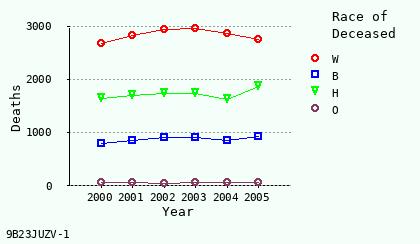
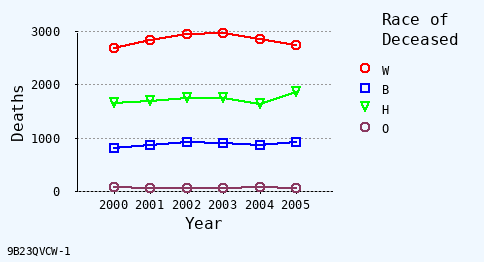
Pick pleasing background
Light yellow is an option.
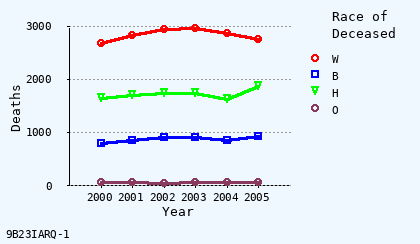
Use grid lines?
Grid lines included.
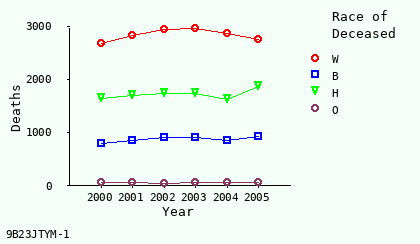
Use grid lines?
Grid lines omitted.

Set line width
Thin lines.
Set line width
Thick lines.

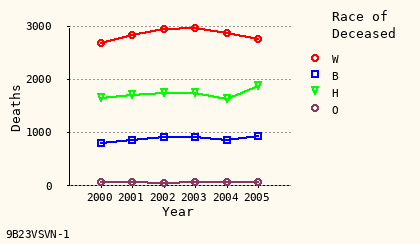
Choose line colors
Colored lines.
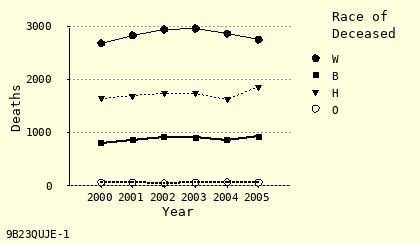
Choose line colors
Black and white lines.
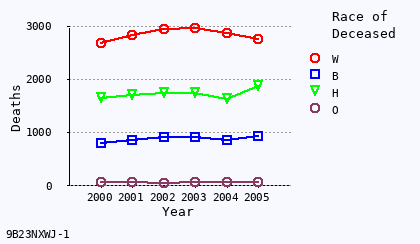
Use symbols?
Symbols included.
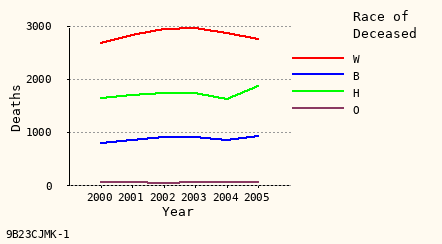
Use symbols?
Symbols omitted.

Choose symbol size
Use 1.0 mm size
Choose symbol size
Use 1.2 mm size
Choose font size
Use 9 pt (smaller) size.
Choose font size
Use 11 pt (bigger) size.
Examples of Vitalnet line chart capabilities:
|
Background:
Alice Blue · Light Yellow · Old Lace |
|
Grid Lines:
Include Grid · Omit Grid |
|
Chart Height:
3 cm High · 4 cm High · 5 cm High |
|
Line Colors:
Colored Lines · Black + White |
|
Line Width:
Thin Lines · Regular · Thick Lines |
|
Point Symbols:
Include Symbols · Omit Symbols |
|
Symbol Size:
Scaled Symbols · 1.0 mm · 1.2 mm |
|
Text Size:
9 pt Text · 10 pt Text · 11 pt Text |
Online help for Vitalnet line charts