|
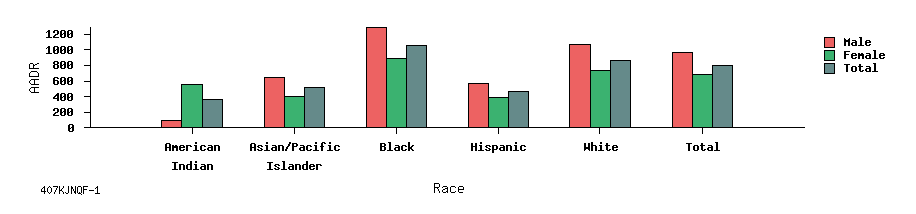
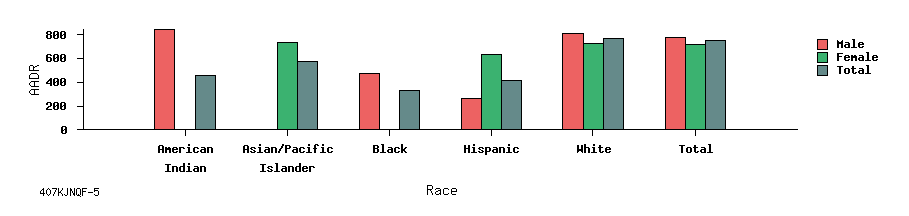
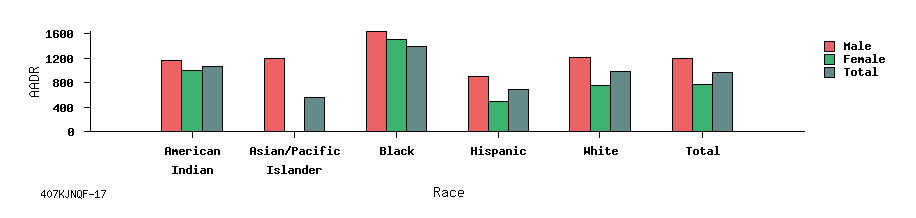
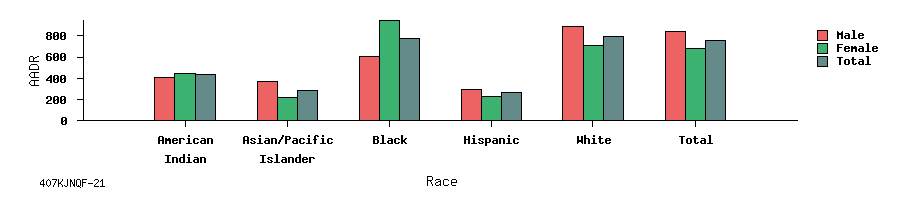
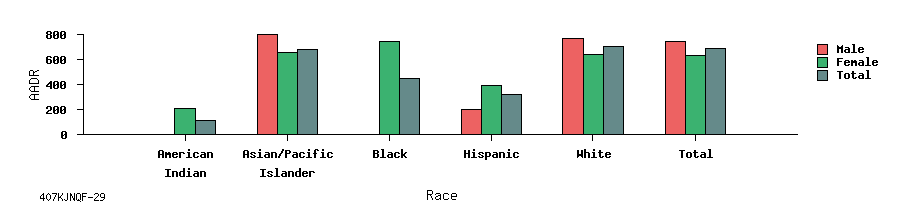
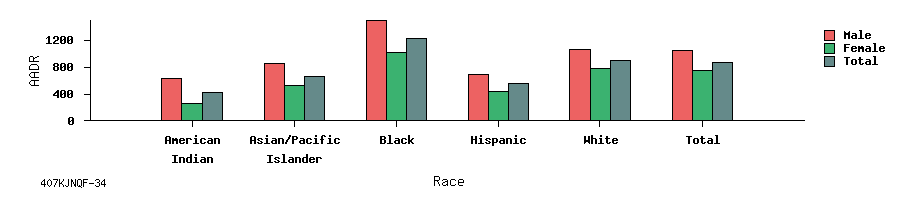
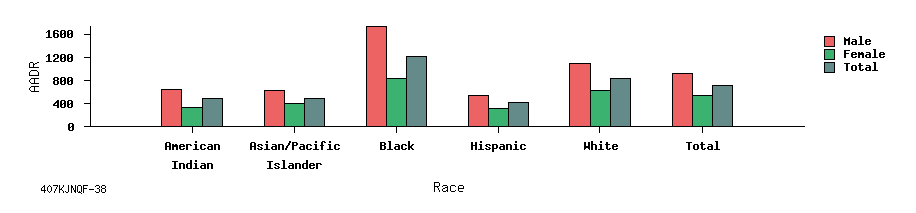
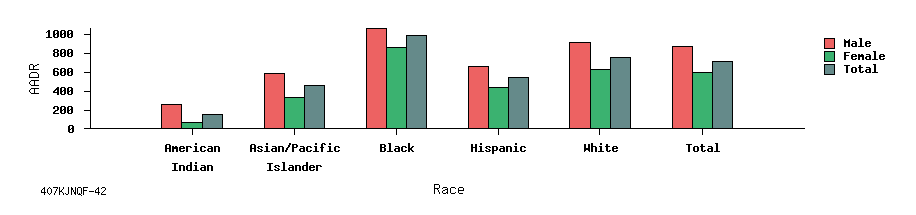
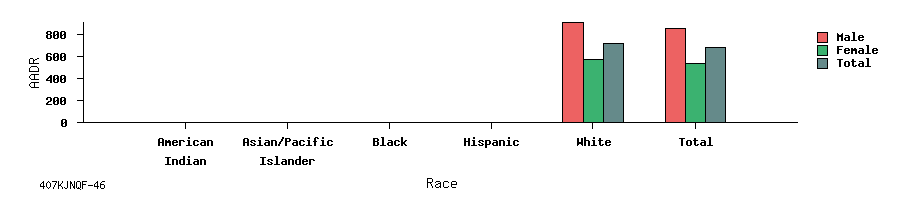
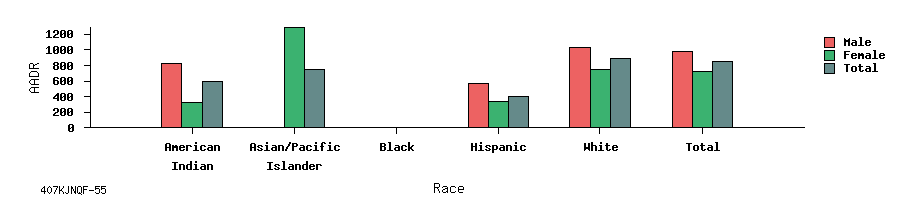
Age-Adjusted Death Rate (AADR) (per 100,000) Age Adjustment Standard Population: 2000 US standard population Row Variable: Race Column Variable: Sex Death Year: 1998 Place of Residence: Alameda Cause of Death: All Causes Of Death (ICD 001-999) |
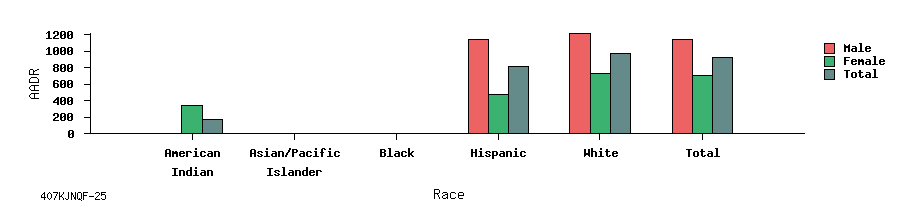
| Race | Male | Female | Total | |||
|---|---|---|---|---|---|---|
| AADR | Deaths | AADR | Deaths | AADR | Deaths | |
| American Indian | 101.6 | 4 | 555.6 | 16 | 365.5 | 20 |
| Asian/Pacific Islander | 650.5 | 538 | 403.8 | 417 | 511.9 | 955 |
| Black | 1,277.6 | 1,041 | 883.1 | 1,034 | 1,049.3 | 2,075 |
| Hispanic | 564.7 | 373 | 384.1 | 287 | 471.0 | 660 |
| White | 1,068.3 | 2,850 | 737.4 | 3,238 | 864.3 | 6,088 |
| Total | 967.8 | 4,806 | 681.0 | 4,992 | 800.3 | 9,798 |
Unknown values excluded from analysis: (Age) (3)
|
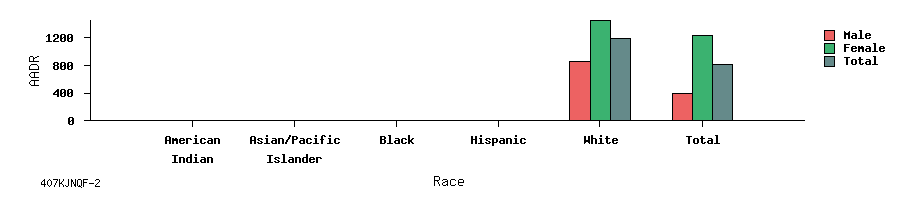
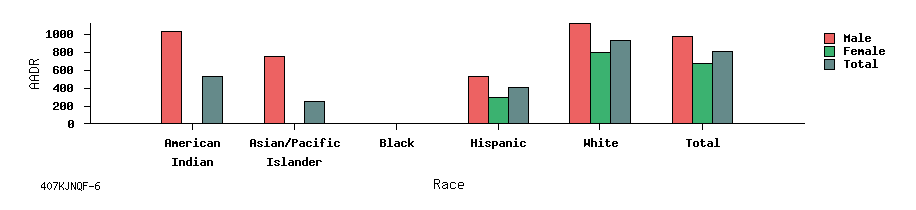
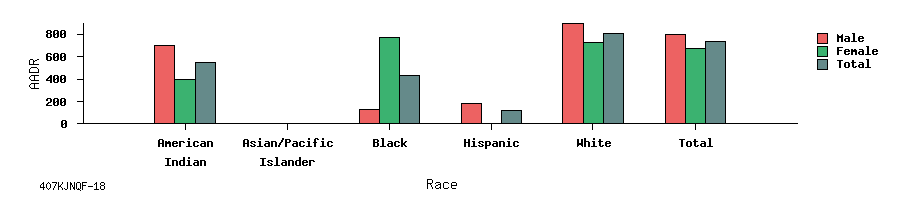
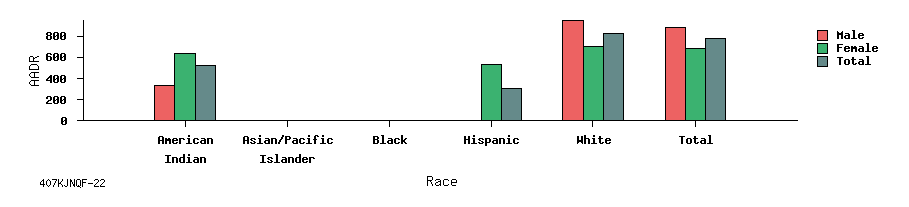
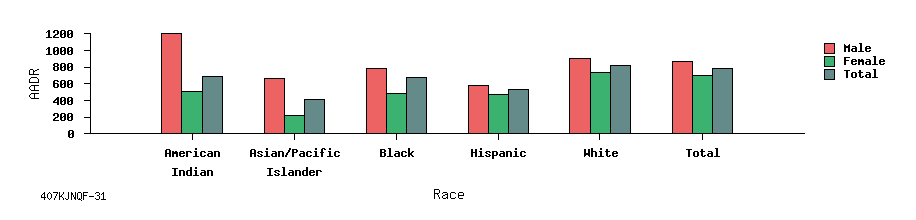
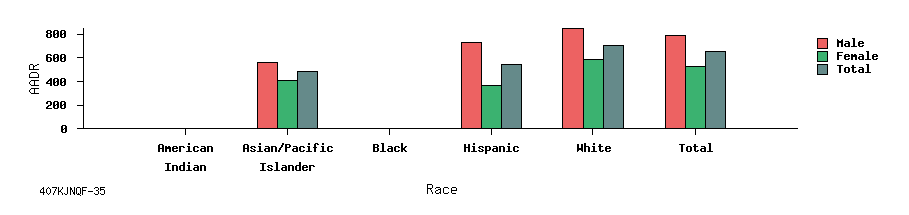
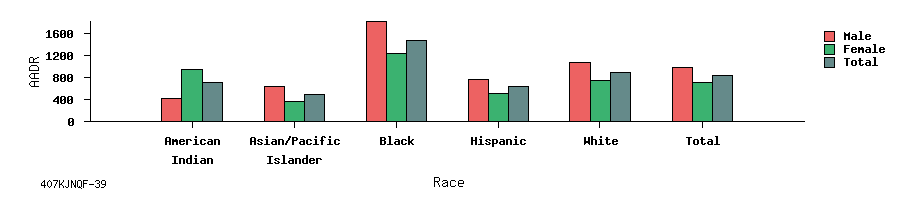
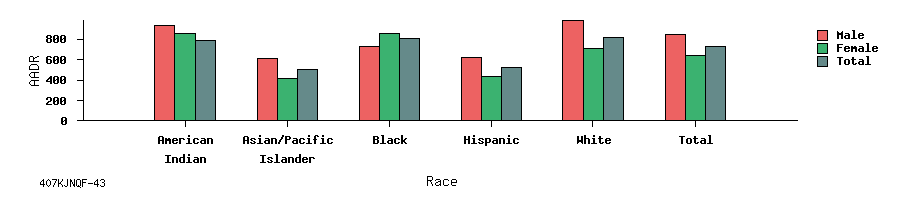
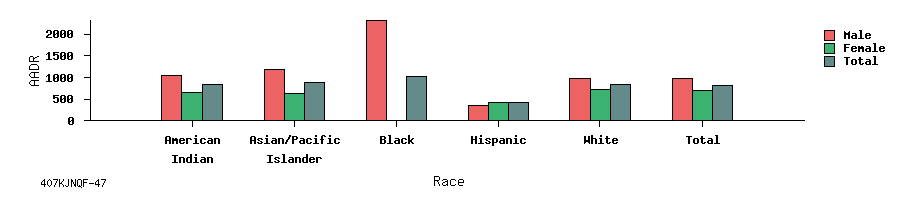
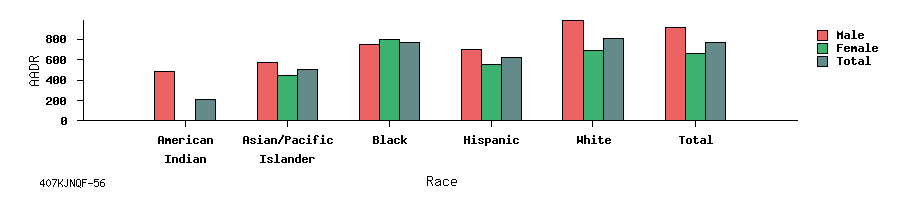
Age-Adjusted Death Rate (AADR) (per 100,000) Age Adjustment Standard Population: 2000 US standard population Row Variable: Race Column Variable: Sex Death Year: 1998 Place of Residence: Alpine Cause of Death: All Causes Of Death (ICD 001-999) |
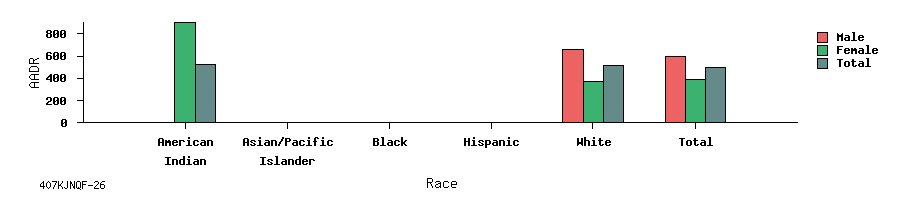
| Race | Male | Female | Total | |||
|---|---|---|---|---|---|---|
| AADR | Deaths | AADR | Deaths | AADR | Deaths | |
| American Indian | 0.0 | 0 | 0.0 | 0 | 0.0 | 0 |
| Asian/Pacific Islander | 0.0 | 0 | 0.0 | 0 | 0.0 | 0 |
| Black | 0.0 | 0 | 0.0 | 0 | 0.0 | 0 |
| Hispanic | 0.0 | 0 | 0.0 | 0 | 0.0 | 0 |
| White | 861.9 | 2 | 1,443.2 | 6 | 1,196.3 | 8 |
| Total | 400.9 | 2 | 1,229.0 | 6 | 816.5 | 8 |
|
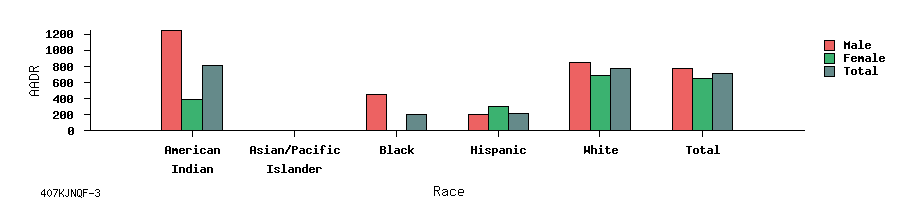
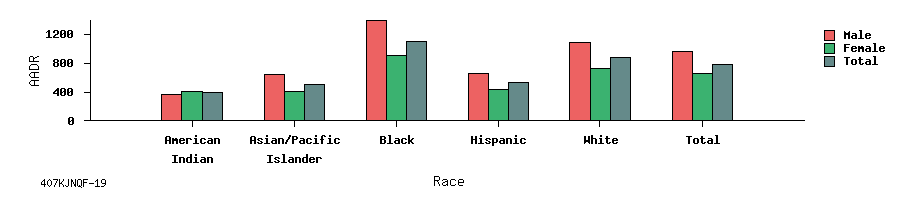
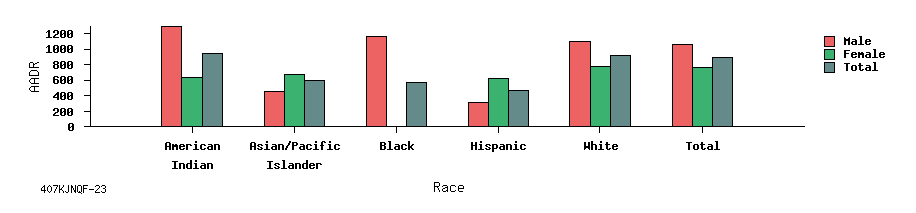
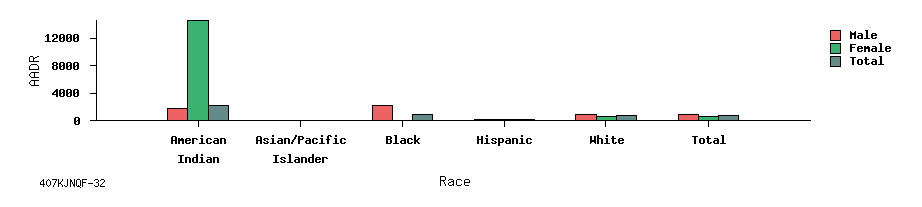
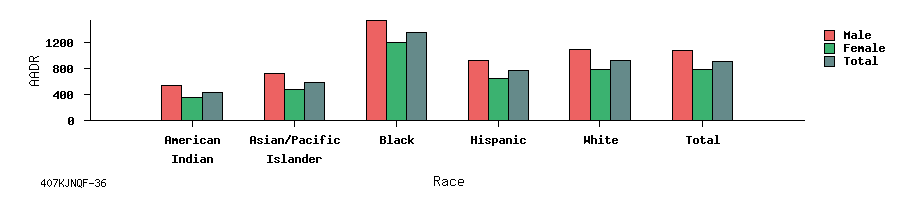
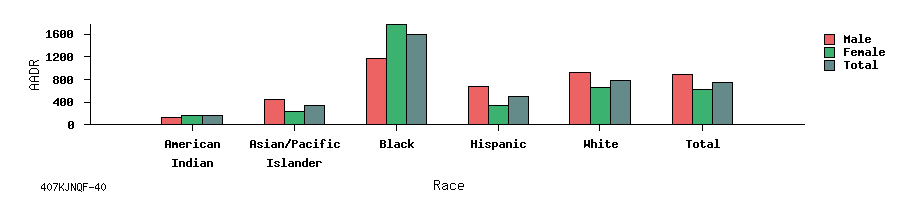
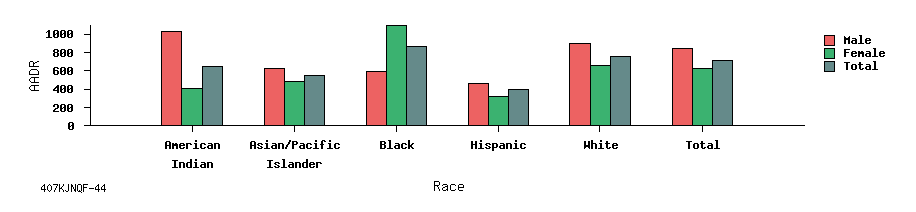
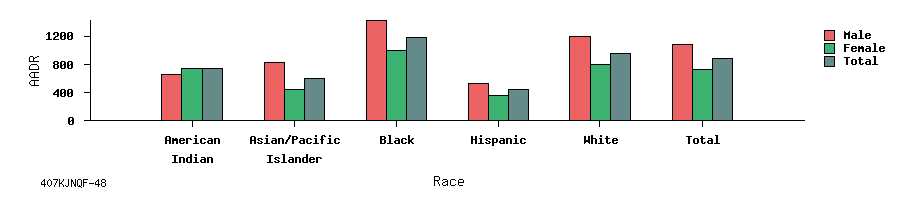
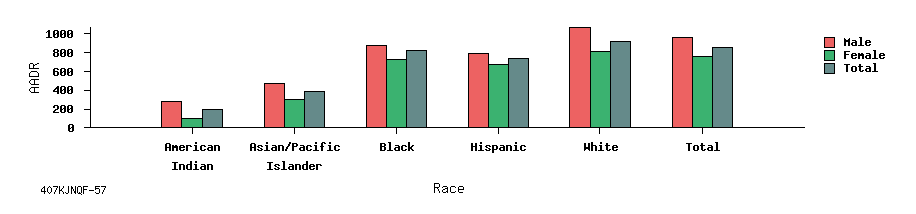
Age-Adjusted Death Rate (AADR) (per 100,000) Age Adjustment Standard Population: 2000 US standard population Row Variable: Race Column Variable: Sex Death Year: 1998 Place of Residence: Amador Cause of Death: All Causes Of Death (ICD 001-999) |
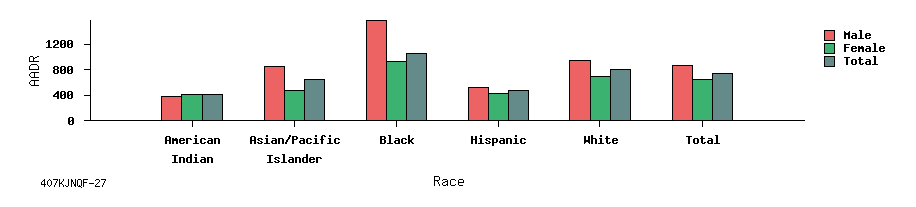
| Race | Male | Female | Total | |||
|---|---|---|---|---|---|---|
| AADR | Deaths | AADR | Deaths | AADR | Deaths | |
| American Indian | 1,239.7 | 3 | 387.7 | 1 | 814.8 | 4 |
| Asian/Pacific Islander | 0.0 | 0 | 0.0 | 0 | 0.0 | 0 |
| Black | 448.4 | 1 | 0.0 | 0 | 203.8 | 1 |
| Hispanic | 206.0 | 3 | 300.4 | 3 | 218.9 | 6 |
| White | 855.1 | 166 | 691.7 | 156 | 774.1 | 322 |
| Total | 772.4 | 173 | 653.1 | 160 | 716.6 | 333 |
|
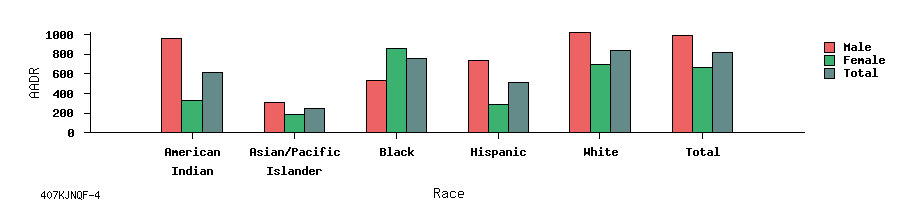
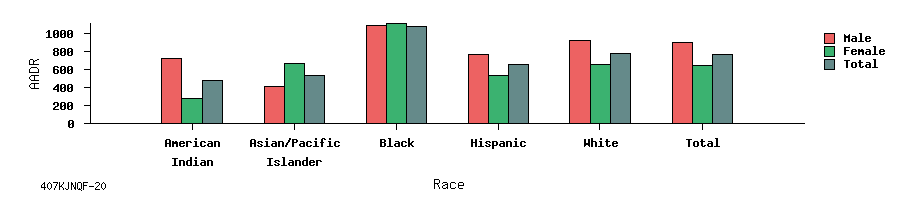
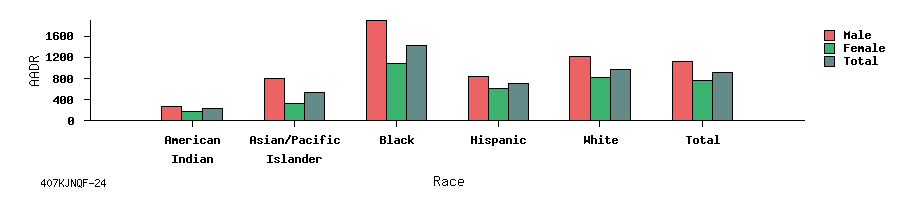
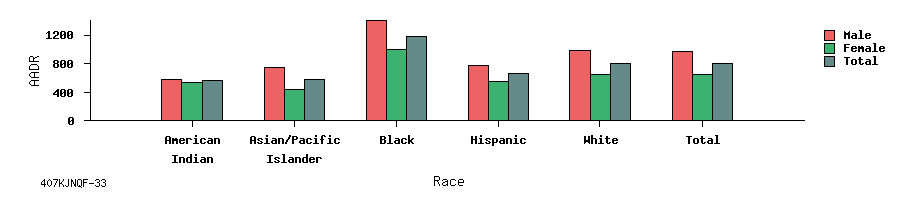
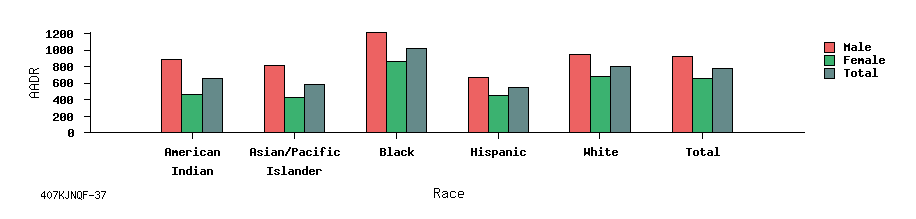
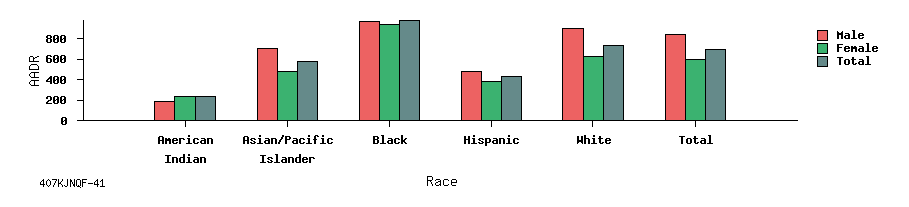
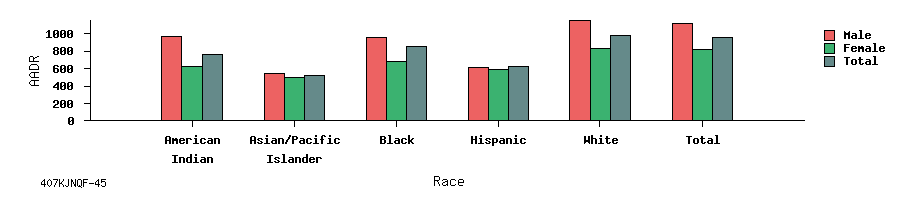
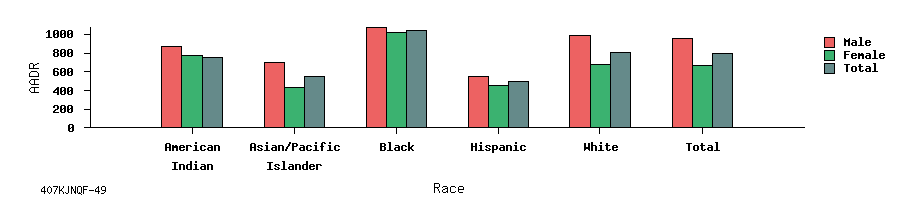
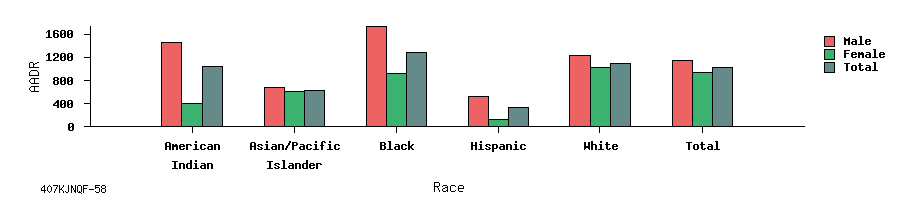
Age-Adjusted Death Rate (AADR) (per 100,000) Age Adjustment Standard Population: 2000 US standard population Row Variable: Race Column Variable: Sex Death Year: 1998 Place of Residence: Butte Cause of Death: All Causes Of Death (ICD 001-999) |
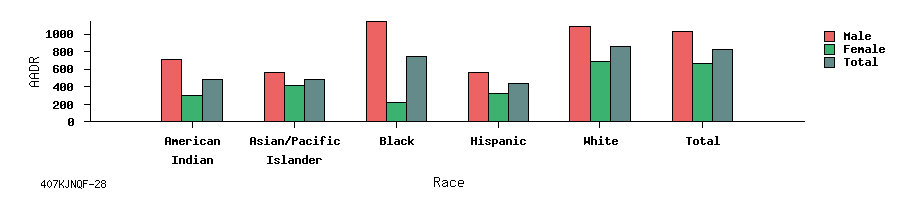
| Race | Male | Female | Total | |||
|---|---|---|---|---|---|---|
| AADR | Deaths | AADR | Deaths | AADR | Deaths | |
| American Indian | 961.4 | 13 | 332.3 | 6 | 612.8 | 19 |
| Asian/Pacific Islander | 310.6 | 10 | 189.4 | 5 | 253.6 | 15 |
| Black | 536.3 | 6 | 858.4 | 11 | 754.6 | 17 |
| Hispanic | 736.6 | 34 | 294.0 | 14 | 507.7 | 48 |
| White | 1,015.3 | 1,037 | 696.3 | 997 | 837.5 | 2,034 |
| Total | 988.3 | 1,100 | 668.8 | 1,033 | 812.4 | 2,133 |
|
Age-Adjusted Death Rate (AADR) (per 100,000) Age Adjustment Standard Population: 2000 US standard population Row Variable: Race Column Variable: Sex Death Year: 1998 Place of Residence: Calaveras Cause of Death: All Causes Of Death (ICD 001-999) |
| Race | Male | Female | Total | |||
|---|---|---|---|---|---|---|
| AADR | Deaths | AADR | Deaths | AADR | Deaths | |
| American Indian | 837.7 | 3 | 0.0 | 0 | 454.0 | 3 |
| Asian/Pacific Islander | 0.0 | 0 | 733.7 | 2 | 574.2 | 2 |
| Black | 471.7 | 1 | 0.0 | 0 | 330.2 | 1 |
| Hispanic | 265.9 | 3 | 629.5 | 5 | 414.4 | 8 |
| White | 806.6 | 179 | 721.1 | 189 | 767.0 | 368 |
| Total | 778.5 | 186 | 713.5 | 196 | 749.2 | 382 |
|
Age-Adjusted Death Rate (AADR) (per 100,000) Age Adjustment Standard Population: 2000 US standard population Row Variable: Race Column Variable: Sex Death Year: 1998 Place of Residence: Colusa Cause of Death: All Causes Of Death (ICD 001-999) |
| Race | Male | Female | Total | |||
|---|---|---|---|---|---|---|
| AADR | Deaths | AADR | Deaths | AADR | Deaths | |
| American Indian | 1,026.4 | 2 | 0.0 | 0 | 528.8 | 2 |
| Asian/Pacific Islander | 747.4 | 1 | 0.0 | 0 | 249.1 | 1 |
| Black | 0.0 | 0 | 0.0 | 0 | 0.0 | 0 |
| Hispanic | 532.3 | 12 | 295.9 | 6 | 407.4 | 18 |
| White | 1,112.0 | 64 | 795.9 | 61 | 933.8 | 125 |
| Total | 969.0 | 79 | 668.5 | 67 | 805.0 | 146 |
|
Age-Adjusted Death Rate (AADR) (per 100,000) Age Adjustment Standard Population: 2000 US standard population Row Variable: Race Column Variable: Sex Death Year: 1998 Place of Residence: Contra Costa Cause of Death: All Causes Of Death (ICD 001-999) |
| Race | Male | Female | Total | |||
|---|---|---|---|---|---|---|
| AADR | Deaths | AADR | Deaths | AADR | Deaths | |
| American Indian | 231.4 | 5 | 442.4 | 10 | 352.0 | 15 |
| Asian/Pacific Islander | 601.8 | 186 | 439.2 | 165 | 511.3 | 351 |
| Black | 1,591.1 | 402 | 984.3 | 322 | 1,242.8 | 724 |
| Hispanic | 749.7 | 236 | 485.4 | 181 | 602.3 | 417 |
| White | 949.2 | 2,452 | 692.2 | 2,698 | 799.6 | 5,150 |
| Total | 947.3 | 3,281 | 684.7 | 3,376 | 797.2 | 6,657 |
Unknown values excluded from analysis: (Age) (2)
|
Age-Adjusted Death Rate (AADR) (per 100,000) Age Adjustment Standard Population: 2000 US standard population Row Variable: Race Column Variable: Sex Death Year: 1998 Place of Residence: Del Norte Cause of Death: All Causes Of Death (ICD 001-999) |
| Race | Male | Female | Total | |||
|---|---|---|---|---|---|---|
| AADR | Deaths | AADR | Deaths | AADR | Deaths | |
| American Indian | 611.2 | 3 | 688.0 | 5 | 657.9 | 8 |
| Asian/Pacific Islander | 0.0 | 0 | 165.4 | 1 | 74.3 | 1 |
| Black | 0.0 | 0 | 0.0 | 0 | 0.0 | 0 |
| Hispanic | 1,009.1 | 8 | 0.0 | 0 | 503.8 | 8 |
| White | 1,027.6 | 125 | 898.9 | 130 | 967.7 | 255 |
| Total | 988.2 | 136 | 851.9 | 136 | 919.8 | 272 |
|
Age-Adjusted Death Rate (AADR) (per 100,000) Age Adjustment Standard Population: 2000 US standard population Row Variable: Race Column Variable: Sex Death Year: 1998 Place of Residence: El Dorado Cause of Death: All Causes Of Death (ICD 001-999) |
| Race | Male | Female | Total | |||
|---|---|---|---|---|---|---|
| AADR | Deaths | AADR | Deaths | AADR | Deaths | |
| American Indian | 0.0 | 0 | 555.3 | 4 | 320.9 | 4 |
| Asian/Pacific Islander | 658.6 | 8 | 178.5 | 2 | 387.7 | 10 |
| Black | 4,299.5 | 7 | 581.6 | 1 | 2,261.3 | 8 |
| Hispanic | 728.2 | 20 | 333.2 | 10 | 523.7 | 30 |
| White | 888.2 | 554 | 644.3 | 471 | 760.3 | 1,025 |
| Total | 873.7 | 589 | 625.5 | 488 | 743.8 | 1,077 |
Unknown values excluded from analysis: (Age) (1)
|
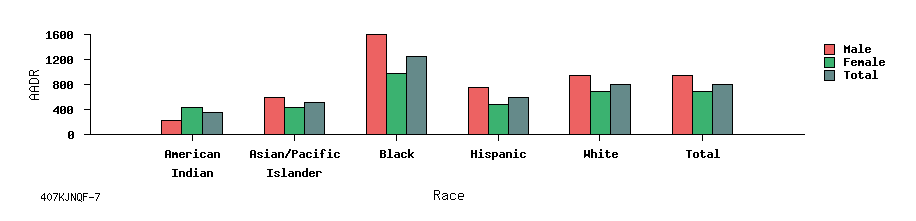
Age-Adjusted Death Rate (AADR) (per 100,000) Age Adjustment Standard Population: 2000 US standard population Row Variable: Race Column Variable: Sex Death Year: 1998 Place of Residence: Fresno Cause of Death: All Causes Of Death (ICD 001-999) |
| Race | Male | Female | Total | |||
|---|---|---|---|---|---|---|
| AADR | Deaths | AADR | Deaths | AADR | Deaths | |
| American Indian | 472.1 | 12 | 267.6 | 8 | 360.3 | 20 |
| Asian/Pacific Islander | 594.8 | 148 | 418.3 | 115 | 502.9 | 263 |
| Black | 1,781.0 | 196 | 1,087.2 | 159 | 1,385.2 | 355 |
| Hispanic | 805.7 | 610 | 564.8 | 436 | 680.1 | 1,046 |
| White | 1,102.4 | 1,809 | 743.3 | 1,927 | 891.9 | 3,736 |
| Total | 1,019.2 | 2,775 | 702.2 | 2,645 | 842.2 | 5,420 |
Unknown values excluded from analysis: (Age) (2)
|
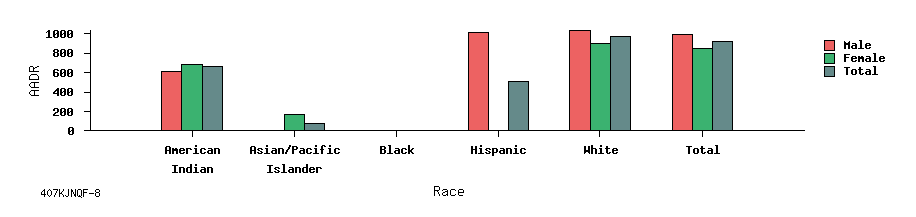
Age-Adjusted Death Rate (AADR) (per 100,000) Age Adjustment Standard Population: 2000 US standard population Row Variable: Race Column Variable: Sex Death Year: 1998 Place of Residence: Glenn Cause of Death: All Causes Of Death (ICD 001-999) |
| Race | Male | Female | Total | |||
|---|---|---|---|---|---|---|
| AADR | Deaths | AADR | Deaths | AADR | Deaths | |
| American Indian | 0.0 | 0 | 388.5 | 1 | 287.1 | 1 |
| Asian/Pacific Islander | 290.8 | 1 | 775.4 | 1 | 931.2 | 2 |
| Black | 0.0 | 0 | 775.4 | 1 | 775.4 | 1 |
| Hispanic | 505.3 | 9 | 188.8 | 5 | 339.0 | 14 |
| White | 1,008.0 | 97 | 781.3 | 105 | 873.6 | 202 |
| Total | 909.0 | 107 | 707.8 | 113 | 791.5 | 220 |
|
Age-Adjusted Death Rate (AADR) (per 100,000) Age Adjustment Standard Population: 2000 US standard population Row Variable: Race Column Variable: Sex Death Year: 1998 Place of Residence: Humboldt Cause of Death: All Causes Of Death (ICD 001-999) |
| Race | Male | Female | Total | |||
|---|---|---|---|---|---|---|
| AADR | Deaths | AADR | Deaths | AADR | Deaths | |
| American Indian | 1,293.7 | 25 | 788.2 | 20 | 1,011.7 | 45 |
| Asian/Pacific Islander | 332.2 | 4 | 588.3 | 6 | 473.5 | 10 |
| Black | 1,072.7 | 4 | 1,122.7 | 2 | 944.7 | 6 |
| Hispanic | 734.5 | 12 | 392.1 | 9 | 546.3 | 21 |
| White | 1,179.6 | 550 | 835.7 | 544 | 978.0 | 1,094 |
| Total | 1,149.6 | 595 | 817.7 | 581 | 957.2 | 1,176 |
Unknown values excluded from analysis: (Age) (1)
|
Age-Adjusted Death Rate (AADR) (per 100,000) Age Adjustment Standard Population: 2000 US standard population Row Variable: Race Column Variable: Sex Death Year: 1998 Place of Residence: Imperial Cause of Death: All Causes Of Death (ICD 001-999) |
| Race | Male | Female | Total | |||
|---|---|---|---|---|---|---|
| AADR | Deaths | AADR | Deaths | AADR | Deaths | |
| American Indian | 1,250.1 | 6 | 347.2 | 3 | 720.0 | 9 |
| Asian/Pacific Islander | 797.9 | 14 | 142.6 | 2 | 496.5 | 16 |
| Black | 1,229.8 | 20 | 473.1 | 7 | 853.8 | 27 |
| Hispanic | 869.9 | 251 | 456.9 | 147 | 646.2 | 398 |
| White | 987.5 | 199 | 675.2 | 166 | 833.4 | 365 |
| Total | 920.6 | 490 | 530.9 | 325 | 716.3 | 815 |
Unknown values excluded from analysis: (Age) (38)
|
Age-Adjusted Death Rate (AADR) (per 100,000) Age Adjustment Standard Population: 2000 US standard population Row Variable: Race Column Variable: Sex Death Year: 1998 Place of Residence: Inyo Cause of Death: All Causes Of Death (ICD 001-999) |
| Race | Male | Female | Total | |||
|---|---|---|---|---|---|---|
| AADR | Deaths | AADR | Deaths | AADR | Deaths | |
| American Indian | 1,119.8 | 7 | 632.1 | 5 | 827.5 | 12 |
| Asian/Pacific Islander | 1,121.0 | 1 | 0.0 | 0 | 747.4 | 1 |
| Black | 0.0 | 0 | 0.0 | 0 | 0.0 | 0 |
| Hispanic | 576.6 | 3 | 712.9 | 5 | 677.0 | 8 |
| White | 1,034.3 | 100 | 590.2 | 87 | 797.7 | 187 |
| Total | 990.4 | 111 | 594.7 | 97 | 779.0 | 208 |
|
Age-Adjusted Death Rate (AADR) (per 100,000) Age Adjustment Standard Population: 2000 US standard population Row Variable: Race Column Variable: Sex Death Year: 1998 Place of Residence: Kern Cause of Death: All Causes Of Death (ICD 001-999) |
| Race | Male | Female | Total | |||
|---|---|---|---|---|---|---|
| AADR | Deaths | AADR | Deaths | AADR | Deaths | |
| American Indian | 289.7 | 8 | 56.3 | 2 | 159.4 | 10 |
| Asian/Pacific Islander | 614.7 | 56 | 474.0 | 41 | 538.4 | 97 |
| Black | 1,458.7 | 165 | 927.7 | 119 | 1,178.0 | 284 |
| Hispanic | 842.4 | 405 | 580.1 | 257 | 710.3 | 662 |
| White | 1,079.1 | 1,817 | 766.8 | 1,755 | 911.7 | 3,572 |
| Total | 1,035.1 | 2,451 | 734.6 | 2,174 | 877.2 | 4,625 |
Unknown values excluded from analysis: (Age) (2)
|
Age-Adjusted Death Rate (AADR) (per 100,000) Age Adjustment Standard Population: 2000 US standard population Row Variable: Race Column Variable: Sex Death Year: 1998 Place of Residence: Kings Cause of Death: All Causes Of Death (ICD 001-999) |
| Race | Male | Female | Total | |||
|---|---|---|---|---|---|---|
| AADR | Deaths | AADR | Deaths | AADR | Deaths | |
| American Indian | 972.8 | 5 | 524.2 | 3 | 717.5 | 8 |
| Asian/Pacific Islander | 529.4 | 7 | 516.3 | 10 | 527.7 | 17 |
| Black | 1,205.5 | 31 | 712.2 | 17 | 969.8 | 48 |
| Hispanic | 926.2 | 94 | 655.7 | 69 | 785.2 | 163 |
| White | 1,003.8 | 253 | 789.1 | 257 | 887.9 | 510 |
| Total | 982.2 | 390 | 742.6 | 356 | 854.2 | 746 |
|
Age-Adjusted Death Rate (AADR) (per 100,000) Age Adjustment Standard Population: 2000 US standard population Row Variable: Race Column Variable: Sex Death Year: 1998 Place of Residence: Lake Cause of Death: All Causes Of Death (ICD 001-999) |
| Race | Male | Female | Total | |||
|---|---|---|---|---|---|---|
| AADR | Deaths | AADR | Deaths | AADR | Deaths | |
| American Indian | 1,159.6 | 5 | 1,009.2 | 5 | 1,071.1 | 10 |
| Asian/Pacific Islander | 1,205.4 | 3 | 0.0 | 0 | 556.4 | 3 |
| Black | 1,630.9 | 12 | 1,507.2 | 10 | 1,390.0 | 22 |
| Hispanic | 897.1 | 15 | 491.7 | 8 | 693.8 | 23 |
| White | 1,220.3 | 397 | 763.6 | 345 | 980.5 | 742 |
| Total | 1,203.0 | 432 | 767.6 | 368 | 975.5 | 800 |
|
Age-Adjusted Death Rate (AADR) (per 100,000) Age Adjustment Standard Population: 2000 US standard population Row Variable: Race Column Variable: Sex Death Year: 1998 Place of Residence: Lassen Cause of Death: All Causes Of Death (ICD 001-999) |
| Race | Male | Female | Total | |||
|---|---|---|---|---|---|---|
| AADR | Deaths | AADR | Deaths | AADR | Deaths | |
| American Indian | 698.5 | 3 | 400.2 | 2 | 549.9 | 5 |
| Asian/Pacific Islander | 0.0 | 0 | 0.0 | 0 | 0.0 | 0 |
| Black | 133.5 | 1 | 775.4 | 1 | 432.7 | 2 |
| Hispanic | 186.2 | 2 | 0.0 | 0 | 116.4 | 2 |
| White | 892.5 | 108 | 725.4 | 96 | 806.4 | 204 |
| Total | 795.9 | 114 | 678.1 | 99 | 733.1 | 213 |
|
Age-Adjusted Death Rate (AADR) (per 100,000) Age Adjustment Standard Population: 2000 US standard population Row Variable: Race Column Variable: Sex Death Year: 1998 Place of Residence: Los Angeles Cause of Death: All Causes Of Death (ICD 001-999) |
| Race | Male | Female | Total | |||
|---|---|---|---|---|---|---|
| AADR | Deaths | AADR | Deaths | AADR | Deaths | |
| American Indian | 362.5 | 41 | 404.6 | 53 | 397.7 | 94 |
| Asian/Pacific Islander | 636.8 | 2,468 | 413.6 | 1,978 | 511.7 | 4,446 |
| Black | 1,383.4 | 4,199 | 899.4 | 4,039 | 1,095.6 | 8,238 |
| Hispanic | 659.7 | 5,960 | 433.6 | 4,707 | 531.8 | 10,667 |
| White | 1,092.5 | 17,048 | 732.4 | 18,422 | 878.3 | 35,470 |
| Total | 966.0 | 29,716 | 650.3 | 29,199 | 782.5 | 58,915 |
Unknown values excluded from analysis: (Age) (8)
|
Age-Adjusted Death Rate (AADR) (per 100,000) Age Adjustment Standard Population: 2000 US standard population Row Variable: Race Column Variable: Sex Death Year: 1998 Place of Residence: Madera Cause of Death: All Causes Of Death (ICD 001-999) |
| Race | Male | Female | Total | |||
|---|---|---|---|---|---|---|
| AADR | Deaths | AADR | Deaths | AADR | Deaths | |
| American Indian | 730.4 | 4 | 285.6 | 2 | 481.1 | 6 |
| Asian/Pacific Islander | 418.3 | 3 | 668.1 | 5 | 535.5 | 8 |
| Black | 1,089.2 | 13 | 1,109.0 | 21 | 1,085.4 | 34 |
| Hispanic | 772.2 | 90 | 540.1 | 50 | 658.4 | 140 |
| White | 929.0 | 321 | 663.4 | 306 | 787.3 | 627 |
| Total | 907.8 | 431 | 648.0 | 384 | 770.8 | 815 |
|
Age-Adjusted Death Rate (AADR) (per 100,000) Age Adjustment Standard Population: 2000 US standard population Row Variable: Race Column Variable: Sex Death Year: 1998 Place of Residence: Marin Cause of Death: All Causes Of Death (ICD 001-999) |
| Race | Male | Female | Total | |||
|---|---|---|---|---|---|---|
| AADR | Deaths | AADR | Deaths | AADR | Deaths | |
| American Indian | 412.7 | 1 | 448.4 | 1 | 433.8 | 2 |
| Asian/Pacific Islander | 375.3 | 13 | 219.1 | 12 | 283.1 | 25 |
| Black | 609.9 | 14 | 940.3 | 18 | 776.6 | 32 |
| Hispanic | 298.6 | 19 | 229.4 | 19 | 266.8 | 38 |
| White | 888.2 | 814 | 713.3 | 940 | 793.7 | 1,754 |
| Total | 837.2 | 861 | 680.0 | 990 | 752.9 | 1,851 |
Unknown values excluded from analysis: (Age) (3)
|
Age-Adjusted Death Rate (AADR) (per 100,000) Age Adjustment Standard Population: 2000 US standard population Row Variable: Race Column Variable: Sex Death Year: 1998 Place of Residence: Mariposa Cause of Death: All Causes Of Death (ICD 001-999) |
| Race | Male | Female | Total | |||
|---|---|---|---|---|---|---|
| AADR | Deaths | AADR | Deaths | AADR | Deaths | |
| American Indian | 335.6 | 1 | 634.4 | 2 | 525.1 | 3 |
| Asian/Pacific Islander | 0.0 | 0 | 0.0 | 0 | 0.0 | 0 |
| Black | 0.0 | 0 | 0.0 | 0 | 0.0 | 0 |
| Hispanic | 0.0 | 0 | 528.8 | 2 | 310.4 | 2 |
| White | 943.4 | 95 | 698.7 | 75 | 820.9 | 170 |
| Total | 882.6 | 96 | 681.5 | 79 | 782.3 | 175 |
Unknown values excluded from analysis: (Age) (1)
|
Age-Adjusted Death Rate (AADR) (per 100,000) Age Adjustment Standard Population: 2000 US standard population Row Variable: Race Column Variable: Sex Death Year: 1998 Place of Residence: Mendocino Cause of Death: All Causes Of Death (ICD 001-999) |
| Race | Male | Female | Total | |||
|---|---|---|---|---|---|---|
| AADR | Deaths | AADR | Deaths | AADR | Deaths | |
| American Indian | 1,285.4 | 15 | 636.7 | 9 | 949.1 | 24 |
| Asian/Pacific Islander | 454.9 | 2 | 678.6 | 4 | 599.2 | 6 |
| Black | 1,160.6 | 2 | 0.0 | 0 | 569.5 | 2 |
| Hispanic | 312.1 | 9 | 628.1 | 15 | 465.4 | 24 |
| White | 1,095.3 | 383 | 773.7 | 370 | 914.3 | 753 |
| Total | 1,057.1 | 411 | 763.7 | 398 | 892.9 | 809 |
|
Age-Adjusted Death Rate (AADR) (per 100,000) Age Adjustment Standard Population: 2000 US standard population Row Variable: Race Column Variable: Sex Death Year: 1998 Place of Residence: Merced Cause of Death: All Causes Of Death (ICD 001-999) |
| Race | Male | Female | Total | |||
|---|---|---|---|---|---|---|
| AADR | Deaths | AADR | Deaths | AADR | Deaths | |
| American Indian | 275.2 | 2 | 177.4 | 1 | 232.5 | 3 |
| Asian/Pacific Islander | 794.8 | 36 | 336.0 | 19 | 541.3 | 55 |
| Black | 1,884.3 | 46 | 1,091.7 | 32 | 1,426.8 | 78 |
| Hispanic | 829.8 | 140 | 611.7 | 103 | 715.5 | 243 |
| White | 1,209.9 | 486 | 815.6 | 490 | 978.8 | 976 |
| Total | 1,112.2 | 710 | 755.4 | 645 | 911.0 | 1,355 |
|
Age-Adjusted Death Rate (AADR) (per 100,000) Age Adjustment Standard Population: 2000 US standard population Row Variable: Race Column Variable: Sex Death Year: 1998 Place of Residence: Modoc Cause of Death: All Causes Of Death (ICD 001-999) |
| Race | Male | Female | Total | |||
|---|---|---|---|---|---|---|
| AADR | Deaths | AADR | Deaths | AADR | Deaths | |
| American Indian | 0.0 | 0 | 344.9 | 1 | 179.4 | 1 |
| Asian/Pacific Islander | 0.0 | 0 | 0.0 | 0 | 0.0 | 0 |
| Black | 0.0 | 0 | 0.0 | 0 | 0.0 | 0 |
| Hispanic | 1,134.7 | 3 | 471.7 | 1 | 816.7 | 4 |
| White | 1,205.8 | 63 | 735.0 | 52 | 971.6 | 115 |
| Total | 1,138.1 | 66 | 710.2 | 54 | 925.8 | 120 |
|
Age-Adjusted Death Rate (AADR) (per 100,000) Age Adjustment Standard Population: 2000 US standard population Row Variable: Race Column Variable: Sex Death Year: 1998 Place of Residence: Mono Cause of Death: All Causes Of Death (ICD 001-999) |
| Race | Male | Female | Total | |||
|---|---|---|---|---|---|---|
| AADR | Deaths | AADR | Deaths | AADR | Deaths | |
| American Indian | 0.0 | 0 | 896.8 | 2 | 527.6 | 2 |
| Asian/Pacific Islander | 0.0 | 0 | 0.0 | 0 | 0.0 | 0 |
| Black | 0.0 | 0 | 0.0 | 0 | 0.0 | 0 |
| Hispanic | 0.0 | 0 | 0.0 | 0 | 0.0 | 0 |
| White | 660.5 | 23 | 368.1 | 13 | 515.7 | 36 |
| Total | 592.2 | 23 | 389.6 | 15 | 495.9 | 38 |
|
Age-Adjusted Death Rate (AADR) (per 100,000) Age Adjustment Standard Population: 2000 US standard population Row Variable: Race Column Variable: Sex Death Year: 1998 Place of Residence: Monterey Cause of Death: All Causes Of Death (ICD 001-999) |
| Race | Male | Female | Total | |||
|---|---|---|---|---|---|---|
| AADR | Deaths | AADR | Deaths | AADR | Deaths | |
| American Indian | 385.7 | 5 | 416.9 | 4 | 408.2 | 9 |
| Asian/Pacific Islander | 856.9 | 102 | 479.5 | 73 | 651.8 | 175 |
| Black | 1,562.2 | 57 | 931.2 | 43 | 1,049.5 | 100 |
| Hispanic | 529.1 | 188 | 434.8 | 135 | 484.1 | 323 |
| White | 947.9 | 780 | 697.9 | 903 | 801.8 | 1,683 |
| Total | 866.5 | 1,132 | 655.6 | 1,158 | 749.8 | 2,290 |
|
Age-Adjusted Death Rate (AADR) (per 100,000) Age Adjustment Standard Population: 2000 US standard population Row Variable: Race Column Variable: Sex Death Year: 1998 Place of Residence: Napa Cause of Death: All Causes Of Death (ICD 001-999) |
| Race | Male | Female | Total | |||
|---|---|---|---|---|---|---|
| AADR | Deaths | AADR | Deaths | AADR | Deaths | |
| American Indian | 707.8 | 2 | 300.2 | 1 | 487.0 | 3 |
| Asian/Pacific Islander | 564.2 | 10 | 412.1 | 8 | 487.6 | 18 |
| Black | 1,140.6 | 7 | 227.7 | 1 | 750.8 | 8 |
| Hispanic | 565.7 | 32 | 326.9 | 19 | 444.6 | 51 |
| White | 1,094.1 | 599 | 690.4 | 600 | 860.8 | 1,199 |
| Total | 1,034.9 | 650 | 662.5 | 629 | 824.0 | 1,279 |
|
Age-Adjusted Death Rate (AADR) (per 100,000) Age Adjustment Standard Population: 2000 US standard population Row Variable: Race Column Variable: Sex Death Year: 1998 Place of Residence: Nevada Cause of Death: All Causes Of Death (ICD 001-999) |
| Race | Male | Female | Total | |||
|---|---|---|---|---|---|---|
| AADR | Deaths | AADR | Deaths | AADR | Deaths | |
| American Indian | 0.0 | 0 | 213.0 | 1 | 115.9 | 1 |
| Asian/Pacific Islander | 796.0 | 2 | 658.5 | 2 | 683.9 | 4 |
| Black | 0.0 | 0 | 747.4 | 1 | 448.4 | 1 |
| Hispanic | 199.1 | 3 | 391.0 | 7 | 322.6 | 10 |
| White | 767.0 | 404 | 641.6 | 435 | 706.1 | 839 |
| Total | 743.3 | 409 | 632.6 | 446 | 689.9 | 855 |
|
Age-Adjusted Death Rate (AADR) (per 100,000) Age Adjustment Standard Population: 2000 US standard population Row Variable: Race Column Variable: Sex Death Year: 1998 Place of Residence: Orange Cause of Death: All Causes Of Death (ICD 001-999) |
| Race | Male | Female | Total | |||
|---|---|---|---|---|---|---|
| AADR | Deaths | AADR | Deaths | AADR | Deaths | |
| American Indian | 408.4 | 10 | 225.4 | 8 | 298.5 | 18 |
| Asian/Pacific Islander | 704.0 | 552 | 476.4 | 446 | 575.3 | 998 |
| Black | 1,278.4 | 96 | 1,077.2 | 86 | 1,175.9 | 182 |
| Hispanic | 633.4 | 866 | 439.8 | 667 | 524.4 | 1,533 |
| White | 1,020.3 | 6,271 | 709.7 | 7,131 | 829.0 | 13,402 |
| Total | 954.8 | 7,795 | 668.7 | 8,338 | 782.2 | 16,133 |

|
Age-Adjusted Death Rate (AADR) (per 100,000) Age Adjustment Standard Population: 2000 US standard population Row Variable: Race Column Variable: Sex Death Year: 1998 Place of Residence: Placer Cause of Death: All Causes Of Death (ICD 001-999) |
| Race | Male | Female | Total | |||
|---|---|---|---|---|---|---|
| AADR | Deaths | AADR | Deaths | AADR | Deaths | |
| American Indian | 1,199.7 | 6 | 512.5 | 4 | 685.0 | 10 |
| Asian/Pacific Islander | 661.5 | 17 | 226.0 | 7 | 417.7 | 24 |
| Black | 779.9 | 6 | 480.3 | 3 | 675.1 | 9 |
| Hispanic | 582.5 | 35 | 473.5 | 30 | 528.8 | 65 |
| White | 904.7 | 741 | 741.1 | 803 | 818.2 | 1,544 |
| Total | 872.0 | 805 | 706.6 | 847 | 785.3 | 1,652 |
|
Age-Adjusted Death Rate (AADR) (per 100,000) Age Adjustment Standard Population: 2000 US standard population Row Variable: Race Column Variable: Sex Death Year: 1998 Place of Residence: Plumas Cause of Death: All Causes Of Death (ICD 001-999) |
| Race | Male | Female | Total | |||
|---|---|---|---|---|---|---|
| AADR | Deaths | AADR | Deaths | AADR | Deaths | |
| American Indian | 1,766.5 | 4 | 14,475.4 | 3 | 2,230.4 | 7 |
| Asian/Pacific Islander | 0.0 | 0 | 0.0 | 0 | 0.0 | 0 |
| Black | 2,256.0 | 2 | 0.0 | 0 | 967.3 | 2 |
| Hispanic | 221.5 | 1 | 198.3 | 1 | 212.7 | 2 |
| White | 942.3 | 113 | 612.3 | 84 | 771.7 | 197 |
| Total | 943.6 | 120 | 627.7 | 88 | 781.1 | 208 |
|
Age-Adjusted Death Rate (AADR) (per 100,000) Age Adjustment Standard Population: 2000 US standard population Row Variable: Race Column Variable: Sex Death Year: 1998 Place of Residence: Riverside Cause of Death: All Causes Of Death (ICD 001-999) |
| Race | Male | Female | Total | |||
|---|---|---|---|---|---|---|
| AADR | Deaths | AADR | Deaths | AADR | Deaths | |
| American Indian | 587.4 | 26 | 536.7 | 26 | 567.1 | 52 |
| Asian/Pacific Islander | 750.6 | 116 | 442.3 | 85 | 581.1 | 201 |
| Black | 1,400.0 | 323 | 997.0 | 263 | 1,186.4 | 586 |
| Hispanic | 773.2 | 778 | 556.6 | 553 | 663.9 | 1,331 |
| White | 983.9 | 5,008 | 655.5 | 4,582 | 806.0 | 9,590 |
| Total | 970.1 | 6,251 | 656.4 | 5,509 | 801.4 | 11,760 |
Unknown values excluded from analysis: (Age) (6)
|
Age-Adjusted Death Rate (AADR) (per 100,000) Age Adjustment Standard Population: 2000 US standard population Row Variable: Race Column Variable: Sex Death Year: 1998 Place of Residence: Sacramento Cause of Death: All Causes Of Death (ICD 001-999) |
| Race | Male | Female | Total | |||
|---|---|---|---|---|---|---|
| AADR | Deaths | AADR | Deaths | AADR | Deaths | |
| American Indian | 635.5 | 27 | 259.9 | 12 | 427.1 | 39 |
| Asian/Pacific Islander | 852.4 | 335 | 520.3 | 250 | 667.0 | 585 |
| Black | 1,486.5 | 435 | 1,012.0 | 351 | 1,223.6 | 786 |
| Hispanic | 697.3 | 289 | 445.7 | 191 | 564.3 | 480 |
| White | 1,070.0 | 3,303 | 773.9 | 3,587 | 896.3 | 6,890 |
| Total | 1,047.2 | 4,389 | 743.9 | 4,391 | 874.1 | 8,780 |
|
Age-Adjusted Death Rate (AADR) (per 100,000) Age Adjustment Standard Population: 2000 US standard population Row Variable: Race Column Variable: Sex Death Year: 1998 Place of Residence: San Benito Cause of Death: All Causes Of Death (ICD 001-999) |
| Race | Male | Female | Total | |||
|---|---|---|---|---|---|---|
| AADR | Deaths | AADR | Deaths | AADR | Deaths | |
| American Indian | 0.0 | 0 | 0.0 | 0 | 0.0 | 0 |
| Asian/Pacific Islander | 561.9 | 3 | 409.6 | 4 | 481.0 | 7 |
| Black | 0.0 | 0 | 0.0 | 0 | 0.0 | 0 |
| Hispanic | 728.9 | 43 | 370.3 | 22 | 543.3 | 65 |
| White | 843.8 | 106 | 589.3 | 95 | 707.7 | 201 |
| Total | 788.5 | 152 | 523.8 | 121 | 650.5 | 273 |
|
Age-Adjusted Death Rate (AADR) (per 100,000) Age Adjustment Standard Population: 2000 US standard population Row Variable: Race Column Variable: Sex Death Year: 1998 Place of Residence: San Bernardino Cause of Death: All Causes Of Death (ICD 001-999) |
| Race | Male | Female | Total | |||
|---|---|---|---|---|---|---|
| AADR | Deaths | AADR | Deaths | AADR | Deaths | |
| American Indian | 546.8 | 20 | 353.2 | 15 | 437.6 | 35 |
| Asian/Pacific Islander | 728.4 | 130 | 488.1 | 117 | 592.1 | 247 |
| Black | 1,534.6 | 433 | 1,198.2 | 381 | 1,354.8 | 814 |
| Hispanic | 925.9 | 978 | 649.2 | 721 | 778.4 | 1,699 |
| White | 1,100.6 | 3,820 | 797.8 | 4,022 | 926.5 | 7,842 |
| Total | 1,084.6 | 5,381 | 785.1 | 5,256 | 915.7 | 10,637 |
Unknown values excluded from analysis: (Age) (1)
|
Age-Adjusted Death Rate (AADR) (per 100,000) Age Adjustment Standard Population: 2000 US standard population Row Variable: Race Column Variable: Sex Death Year: 1998 Place of Residence: San Diego Cause of Death: All Causes Of Death (ICD 001-999) |
| Race | Male | Female | Total | |||
|---|---|---|---|---|---|---|
| AADR | Deaths | AADR | Deaths | AADR | Deaths | |
| American Indian | 885.2 | 50 | 461.0 | 30 | 661.0 | 80 |
| Asian/Pacific Islander | 811.3 | 473 | 424.0 | 351 | 582.0 | 824 |
| Black | 1,209.3 | 441 | 864.4 | 364 | 1,025.4 | 805 |
| Hispanic | 674.3 | 977 | 458.4 | 803 | 554.2 | 1,780 |
| White | 953.4 | 7,465 | 686.3 | 7,797 | 805.0 | 15,262 |
| Total | 926.7 | 9,406 | 654.9 | 9,345 | 774.8 | 18,751 |
Unknown values excluded from analysis: (Age) (16)
|
Age-Adjusted Death Rate (AADR) (per 100,000) Age Adjustment Standard Population: 2000 US standard population Row Variable: Race Column Variable: Sex Death Year: 1998 Place of Residence: San Francisco Cause of Death: All Causes Of Death (ICD 001-999) |
| Race | Male | Female | Total | |||
|---|---|---|---|---|---|---|
| AADR | Deaths | AADR | Deaths | AADR | Deaths | |
| American Indian | 648.3 | 9 | 336.7 | 4 | 498.9 | 13 |
| Asian/Pacific Islander | 624.2 | 798 | 405.2 | 687 | 500.6 | 1,485 |
| Black | 1,727.7 | 547 | 833.5 | 378 | 1,217.2 | 925 |
| Hispanic | 539.3 | 258 | 320.0 | 227 | 428.5 | 485 |
| White | 1,097.3 | 1,887 | 634.9 | 1,851 | 840.1 | 3,738 |
| Total | 926.2 | 3,499 | 541.5 | 3,147 | 714.3 | 6,646 |
Unknown values excluded from analysis: (Age) (3)
|
Age-Adjusted Death Rate (AADR) (per 100,000) Age Adjustment Standard Population: 2000 US standard population Row Variable: Race Column Variable: Sex Death Year: 1998 Place of Residence: San Joaquin Cause of Death: All Causes Of Death (ICD 001-999) |
| Race | Male | Female | Total | |||
|---|---|---|---|---|---|---|
| AADR | Deaths | AADR | Deaths | AADR | Deaths | |
| American Indian | 427.9 | 6 | 956.5 | 15 | 724.6 | 21 |
| Asian/Pacific Islander | 637.9 | 207 | 377.5 | 120 | 508.2 | 327 |
| Black | 1,817.8 | 161 | 1,242.1 | 126 | 1,489.3 | 287 |
| Hispanic | 770.7 | 307 | 510.5 | 202 | 638.9 | 509 |
| White | 1,089.4 | 1,495 | 760.8 | 1,539 | 900.4 | 3,034 |
| Total | 997.7 | 2,176 | 710.1 | 2,002 | 840.8 | 4,178 |
|
Age-Adjusted Death Rate (AADR) (per 100,000) Age Adjustment Standard Population: 2000 US standard population Row Variable: Race Column Variable: Sex Death Year: 1998 Place of Residence: San Luis Obispo Cause of Death: All Causes Of Death (ICD 001-999) |
| Race | Male | Female | Total | |||
|---|---|---|---|---|---|---|
| AADR | Deaths | AADR | Deaths | AADR | Deaths | |
| American Indian | 131.9 | 1 | 163.2 | 2 | 174.8 | 3 |
| Asian/Pacific Islander | 442.0 | 13 | 242.2 | 8 | 339.0 | 21 |
| Black | 1,174.0 | 17 | 1,759.2 | 11 | 1,589.7 | 28 |
| Hispanic | 684.6 | 52 | 346.4 | 30 | 502.7 | 82 |
| White | 928.3 | 930 | 651.4 | 928 | 774.5 | 1,858 |
| Total | 892.5 | 1,013 | 626.6 | 979 | 747.0 | 1,992 |
|
Age-Adjusted Death Rate (AADR) (per 100,000) Age Adjustment Standard Population: 2000 US standard population Row Variable: Race Column Variable: Sex Death Year: 1998 Place of Residence: San Mateo Cause of Death: All Causes Of Death (ICD 001-999) |
| Race | Male | Female | Total | |||
|---|---|---|---|---|---|---|
| AADR | Deaths | AADR | Deaths | AADR | Deaths | |
| American Indian | 187.9 | 3 | 234.4 | 3 | 234.6 | 6 |
| Asian/Pacific Islander | 708.1 | 292 | 480.6 | 246 | 579.7 | 538 |
| Black | 966.7 | 112 | 935.9 | 125 | 970.0 | 237 |
| Hispanic | 478.1 | 178 | 386.3 | 171 | 432.0 | 349 |
| White | 895.2 | 1,846 | 623.1 | 2,011 | 734.1 | 3,857 |
| Total | 836.0 | 2,431 | 592.5 | 2,556 | 694.1 | 4,987 |
Unknown values excluded from analysis: (Age) (1)
|
Age-Adjusted Death Rate (AADR) (per 100,000) Age Adjustment Standard Population: 2000 US standard population Row Variable: Race Column Variable: Sex Death Year: 1998 Place of Residence: Santa Barbara Cause of Death: All Causes Of Death (ICD 001-999) |
| Race | Male | Female | Total | |||
|---|---|---|---|---|---|---|
| AADR | Deaths | AADR | Deaths | AADR | Deaths | |
| American Indian | 254.2 | 3 | 69.1 | 1 | 149.9 | 4 |
| Asian/Pacific Islander | 589.6 | 42 | 333.4 | 26 | 459.5 | 68 |
| Black | 1,056.5 | 33 | 861.6 | 26 | 988.1 | 59 |
| Hispanic | 655.7 | 202 | 435.1 | 140 | 543.2 | 342 |
| White | 918.8 | 1,137 | 632.8 | 1,262 | 752.7 | 2,399 |
| Total | 871.7 | 1,417 | 599.3 | 1,455 | 718.3 | 2,872 |
|
Age-Adjusted Death Rate (AADR) (per 100,000) Age Adjustment Standard Population: 2000 US standard population Row Variable: Race Column Variable: Sex Death Year: 1998 Place of Residence: Santa Clara Cause of Death: All Causes Of Death (ICD 001-999) |
| Race | Male | Female | Total | |||
|---|---|---|---|---|---|---|
| AADR | Deaths | AADR | Deaths | AADR | Deaths | |
| American Indian | 932.3 | 9 | 856.4 | 15 | 783.9 | 24 |
| Asian/Pacific Islander | 607.0 | 588 | 410.3 | 467 | 500.0 | 1,055 |
| Black | 731.5 | 97 | 851.4 | 111 | 806.3 | 208 |
| Hispanic | 616.8 | 589 | 433.0 | 468 | 517.7 | 1,057 |
| White | 975.6 | 3,082 | 710.8 | 3,550 | 813.0 | 6,632 |
| Total | 848.2 | 4,365 | 635.3 | 4,611 | 724.1 | 8,976 |
Unknown values excluded from analysis: (Age) (1)
|
Age-Adjusted Death Rate (AADR) (per 100,000) Age Adjustment Standard Population: 2000 US standard population Row Variable: Race Column Variable: Sex Death Year: 1998 Place of Residence: Santa Cruz Cause of Death: All Causes Of Death (ICD 001-999) |
| Race | Male | Female | Total | |||
|---|---|---|---|---|---|---|
| AADR | Deaths | AADR | Deaths | AADR | Deaths | |
| American Indian | 1,028.3 | 3 | 407.7 | 2 | 650.1 | 5 |
| Asian/Pacific Islander | 626.0 | 32 | 481.2 | 23 | 552.4 | 55 |
| Black | 595.4 | 4 | 1,089.7 | 8 | 862.7 | 12 |
| Hispanic | 465.7 | 77 | 325.3 | 47 | 396.9 | 124 |
| White | 903.7 | 674 | 660.8 | 799 | 758.4 | 1,473 |
| Total | 841.6 | 790 | 627.0 | 879 | 719.1 | 1,669 |
Unknown values excluded from analysis: (Age) (1)
|
Age-Adjusted Death Rate (AADR) (per 100,000) Age Adjustment Standard Population: 2000 US standard population Row Variable: Race Column Variable: Sex Death Year: 1998 Place of Residence: Shasta Cause of Death: All Causes Of Death (ICD 001-999) |
| Race | Male | Female | Total | |||
|---|---|---|---|---|---|---|
| AADR | Deaths | AADR | Deaths | AADR | Deaths | |
| American Indian | 965.5 | 15 | 619.8 | 12 | 764.2 | 27 |
| Asian/Pacific Islander | 541.9 | 6 | 494.8 | 6 | 521.7 | 12 |
| Black | 955.1 | 4 | 682.5 | 4 | 853.0 | 8 |
| Hispanic | 611.2 | 13 | 592.7 | 14 | 620.2 | 27 |
| White | 1,146.4 | 826 | 832.1 | 812 | 977.4 | 1,638 |
| Total | 1,119.4 | 864 | 822.4 | 848 | 960.1 | 1,712 |
Unknown values excluded from analysis: (Age) (1)
|
Age-Adjusted Death Rate (AADR) (per 100,000) Age Adjustment Standard Population: 2000 US standard population Row Variable: Race Column Variable: Sex Death Year: 1998 Place of Residence: Sierra Cause of Death: All Causes Of Death (ICD 001-999) |
| Race | Male | Female | Total | |||
|---|---|---|---|---|---|---|
| AADR | Deaths | AADR | Deaths | AADR | Deaths | |
| American Indian | 0.0 | 0 | 0.0 | 0 | 0.0 | 0 |
| Asian/Pacific Islander | 0.0 | 0 | 0.0 | 0 | 0.0 | 0 |
| Black | 0.0 | 0 | 0.0 | 0 | 0.0 | 0 |
| Hispanic | 0.0 | 0 | 0.0 | 0 | 0.0 | 0 |
| White | 904.2 | 20 | 573.3 | 15 | 719.3 | 35 |
| Total | 856.2 | 20 | 541.1 | 15 | 678.9 | 35 |
|
Age-Adjusted Death Rate (AADR) (per 100,000) Age Adjustment Standard Population: 2000 US standard population Row Variable: Race Column Variable: Sex Death Year: 1998 Place of Residence: Siskiyou Cause of Death: All Causes Of Death (ICD 001-999) |
| Race | Male | Female | Total | |||
|---|---|---|---|---|---|---|
| AADR | Deaths | AADR | Deaths | AADR | Deaths | |
| American Indian | 1,038.3 | 9 | 650.7 | 6 | 831.4 | 15 |
| Asian/Pacific Islander | 1,196.7 | 2 | 623.2 | 1 | 897.3 | 3 |
| Black | 2,305.2 | 8 | 0.0 | 0 | 1,017.9 | 8 |
| Hispanic | 368.3 | 3 | 429.1 | 3 | 422.4 | 6 |
| White | 985.4 | 211 | 716.9 | 208 | 839.9 | 419 |
| Total | 983.3 | 233 | 692.6 | 218 | 827.4 | 451 |
|
Age-Adjusted Death Rate (AADR) (per 100,000) Age Adjustment Standard Population: 2000 US standard population Row Variable: Race Column Variable: Sex Death Year: 1998 Place of Residence: Solano Cause of Death: All Causes Of Death (ICD 001-999) |
| Race | Male | Female | Total | |||
|---|---|---|---|---|---|---|
| AADR | Deaths | AADR | Deaths | AADR | Deaths | |
| American Indian | 664.0 | 8 | 742.1 | 7 | 737.5 | 15 |
| Asian/Pacific Islander | 833.8 | 126 | 449.0 | 93 | 606.4 | 219 |
| Black | 1,414.1 | 189 | 990.6 | 146 | 1,184.6 | 335 |
| Hispanic | 529.0 | 80 | 362.8 | 56 | 444.5 | 136 |
| White | 1,199.3 | 857 | 801.5 | 810 | 958.0 | 1,667 |
| Total | 1,085.4 | 1,260 | 734.1 | 1,112 | 883.0 | 2,372 |
Unknown values excluded from analysis: (Age) (1)
|
Age-Adjusted Death Rate (AADR) (per 100,000) Age Adjustment Standard Population: 2000 US standard population Row Variable: Race Column Variable: Sex Death Year: 1998 Place of Residence: Sonoma Cause of Death: All Causes Of Death (ICD 001-999) |
| Race | Male | Female | Total | |||
|---|---|---|---|---|---|---|
| AADR | Deaths | AADR | Deaths | AADR | Deaths | |
| American Indian | 865.1 | 10 | 778.8 | 12 | 757.0 | 22 |
| Asian/Pacific Islander | 695.7 | 28 | 434.2 | 25 | 546.4 | 53 |
| Black | 1,067.6 | 23 | 1,022.6 | 20 | 1,044.6 | 43 |
| Hispanic | 547.5 | 75 | 458.3 | 69 | 499.6 | 144 |
| White | 990.1 | 1,679 | 678.8 | 1,748 | 810.1 | 3,427 |
| Total | 956.3 | 1,815 | 670.1 | 1,874 | 791.6 | 3,689 |
Unknown values excluded from analysis: (Age) (1)
|
Age-Adjusted Death Rate (AADR) (per 100,000) Age Adjustment Standard Population: 2000 US standard population Row Variable: Race Column Variable: Sex Death Year: 1998 Place of Residence: Stanislaus Cause of Death: All Causes Of Death (ICD 001-999) |
| Race | Male | Female | Total | |||
|---|---|---|---|---|---|---|
| AADR | Deaths | AADR | Deaths | AADR | Deaths | |
| American Indian | 475.0 | 9 | 282.8 | 6 | 369.2 | 15 |
| Asian/Pacific Islander | 798.5 | 50 | 547.5 | 34 | 663.4 | 84 |
| Black | 1,314.0 | 35 | 1,048.6 | 26 | 1,180.9 | 61 |
| Hispanic | 683.9 | 180 | 499.4 | 130 | 595.3 | 310 |
| White | 1,167.2 | 1,399 | 840.0 | 1,515 | 977.7 | 2,914 |
| Total | 1,090.7 | 1,673 | 794.9 | 1,711 | 924.4 | 3,384 |
Unknown values excluded from analysis: (Age) (2)
|
Age-Adjusted Death Rate (AADR) (per 100,000) Age Adjustment Standard Population: 2000 US standard population Row Variable: Race Column Variable: Sex Death Year: 1998 Place of Residence: Sutter Cause of Death: All Causes Of Death (ICD 001-999) |
| Race | Male | Female | Total | |||
|---|---|---|---|---|---|---|
| AADR | Deaths | AADR | Deaths | AADR | Deaths | |
| American Indian | 207.7 | 1 | 155.1 | 1 | 176.1 | 2 |
| Asian/Pacific Islander | 780.9 | 23 | 421.0 | 17 | 583.2 | 40 |
| Black | 1,812.3 | 3 | 775.4 | 1 | 1,175.0 | 4 |
| Hispanic | 658.2 | 23 | 647.8 | 23 | 643.6 | 46 |
| White | 983.1 | 249 | 774.5 | 279 | 870.6 | 528 |
| Total | 915.6 | 299 | 736.0 | 321 | 820.0 | 620 |
|
Age-Adjusted Death Rate (AADR) (per 100,000) Age Adjustment Standard Population: 2000 US standard population Row Variable: Race Column Variable: Sex Death Year: 1998 Place of Residence: Tehama Cause of Death: All Causes Of Death (ICD 001-999) |
| Race | Male | Female | Total | |||
|---|---|---|---|---|---|---|
| AADR | Deaths | AADR | Deaths | AADR | Deaths | |
| American Indian | 220.1 | 1 | 227.7 | 1 | 223.9 | 2 |
| Asian/Pacific Islander | 0.0 | 0 | 0.0 | 0 | 0.0 | 0 |
| Black | 1,494.7 | 1 | 1,100.6 | 1 | 1,190.9 | 2 |
| Hispanic | 507.7 | 12 | 263.5 | 5 | 401.6 | 17 |
| White | 1,069.7 | 295 | 718.0 | 268 | 876.8 | 563 |
| Total | 1,022.8 | 309 | 689.7 | 275 | 843.5 | 584 |
|
Age-Adjusted Death Rate (AADR) (per 100,000) Age Adjustment Standard Population: 2000 US standard population Row Variable: Race Column Variable: Sex Death Year: 1998 Place of Residence: Trinity Cause of Death: All Causes Of Death (ICD 001-999) |
| Race | Male | Female | Total | |||
|---|---|---|---|---|---|---|
| AADR | Deaths | AADR | Deaths | AADR | Deaths | |
| American Indian | 717.1 | 2 | 320.3 | 1 | 495.2 | 3 |
| Asian/Pacific Islander | 0.0 | 0 | 0.0 | 0 | 0.0 | 0 |
| Black | 0.0 | 0 | 0.0 | 0 | 0.0 | 0 |
| Hispanic | 650.7 | 2 | 1,282.0 | 2 | 945.1 | 4 |
| White | 1,131.3 | 74 | 954.5 | 76 | 1,051.8 | 150 |
| Total | 1,101.7 | 78 | 944.1 | 79 | 1,033.4 | 157 |

|
Age-Adjusted Death Rate (AADR) (per 100,000) Age Adjustment Standard Population: 2000 US standard population Row Variable: Race Column Variable: Sex Death Year: 1998 Place of Residence: Tulare Cause of Death: All Causes Of Death (ICD 001-999) |
| Race | Male | Female | Total | |||
|---|---|---|---|---|---|---|
| AADR | Deaths | AADR | Deaths | AADR | Deaths | |
| American Indian | 541.5 | 8 | 365.5 | 6 | 445.6 | 14 |
| Asian/Pacific Islander | 442.9 | 37 | 346.5 | 28 | 395.0 | 65 |
| Black | 978.1 | 19 | 619.7 | 15 | 790.9 | 34 |
| Hispanic | 783.4 | 308 | 620.2 | 216 | 704.7 | 524 |
| White | 1,123.3 | 942 | 751.9 | 974 | 908.3 | 1,916 |
| Total | 1,001.6 | 1,314 | 703.8 | 1,239 | 839.0 | 2,553 |
Unknown values excluded from analysis: (Age) (2)
|
Age-Adjusted Death Rate (AADR) (per 100,000) Age Adjustment Standard Population: 2000 US standard population Row Variable: Race Column Variable: Sex Death Year: 1998 Place of Residence: Tuolumne Cause of Death: All Causes Of Death (ICD 001-999) |
| Race | Male | Female | Total | |||
|---|---|---|---|---|---|---|
| AADR | Deaths | AADR | Deaths | AADR | Deaths | |
| American Indian | 823.3 | 4 | 323.1 | 1 | 598.1 | 5 |
| Asian/Pacific Islander | 0.0 | 0 | 1,281.2 | 2 | 747.4 | 2 |
| Black | 0.0 | 0 | 0.0 | 0 | 0.0 | 0 |
| Hispanic | 575.7 | 5 | 344.9 | 4 | 409.2 | 9 |
| White | 1,029.3 | 299 | 748.3 | 268 | 884.7 | 567 |
| Total | 986.0 | 308 | 728.1 | 275 | 855.1 | 583 |
|
Age-Adjusted Death Rate (AADR) (per 100,000) Age Adjustment Standard Population: 2000 US standard population Row Variable: Race Column Variable: Sex Death Year: 1998 Place of Residence: Ventura Cause of Death: All Causes Of Death (ICD 001-999) |
| Race | Male | Female | Total | |||
|---|---|---|---|---|---|---|
| AADR | Deaths | AADR | Deaths | AADR | Deaths | |
| American Indian | 482.4 | 6 | 0.0 | 0 | 209.0 | 6 |
| Asian/Pacific Islander | 569.2 | 70 | 443.7 | 70 | 498.2 | 140 |
| Black | 747.7 | 31 | 798.7 | 38 | 762.1 | 69 |
| Hispanic | 698.9 | 342 | 555.4 | 300 | 621.8 | 642 |
| White | 976.7 | 1,838 | 684.0 | 1,900 | 803.0 | 3,738 |
| Total | 912.4 | 2,287 | 658.8 | 2,308 | 764.9 | 4,595 |
Unknown values excluded from analysis: (Age) (1)
|
Age-Adjusted Death Rate (AADR) (per 100,000) Age Adjustment Standard Population: 2000 US standard population Row Variable: Race Column Variable: Sex Death Year: 1998 Place of Residence: Yolo Cause of Death: All Causes Of Death (ICD 001-999) |
| Race | Male | Female | Total | |||
|---|---|---|---|---|---|---|
| AADR | Deaths | AADR | Deaths | AADR | Deaths | |
| American Indian | 283.2 | 2 | 104.2 | 1 | 193.3 | 3 |
| Asian/Pacific Islander | 474.8 | 18 | 305.4 | 12 | 383.7 | 30 |
| Black | 880.4 | 10 | 727.3 | 9 | 822.1 | 19 |
| Hispanic | 792.3 | 75 | 674.5 | 55 | 737.3 | 130 |
| White | 1,062.6 | 406 | 810.0 | 455 | 918.1 | 861 |
| Total | 963.4 | 511 | 760.1 | 532 | 855.4 | 1,043 |
|
Age-Adjusted Death Rate (AADR) (per 100,000) Age Adjustment Standard Population: 2000 US standard population Row Variable: Race Column Variable: Sex Death Year: 1998 Place of Residence: Yuba Cause of Death: All Causes Of Death (ICD 001-999) |
| Race | Male | Female | Total | |||
|---|---|---|---|---|---|---|
| AADR | Deaths | AADR | Deaths | AADR | Deaths | |
| American Indian | 1,447.9 | 7 | 398.8 | 2 | 1,035.6 | 9 |
| Asian/Pacific Islander | 677.6 | 11 | 613.7 | 13 | 630.2 | 24 |
| Black | 1,722.7 | 10 | 916.6 | 7 | 1,286.4 | 17 |
| Hispanic | 522.2 | 13 | 136.1 | 4 | 328.4 | 17 |
| White | 1,228.2 | 230 | 1,024.3 | 232 | 1,099.8 | 462 |
| Total | 1,141.6 | 271 | 934.7 | 258 | 1,017.9 | 529 |
|
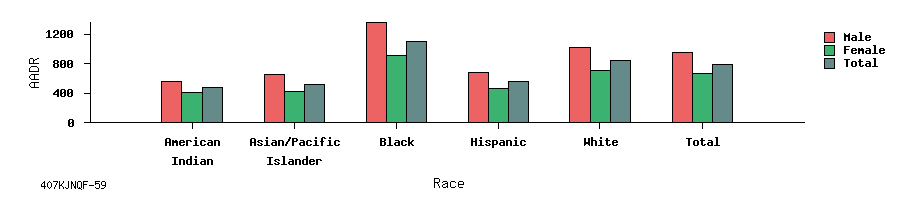
Age-Adjusted Death Rate (AADR) (per 100,000) Age Adjustment Standard Population: 2000 US standard population Row Variable: Race Column Variable: Sex Death Year: 1998 Place of Residence: California Cause of Death: All Causes Of Death (ICD 001-999) |
| Race | Male | Female | Total | |||
|---|---|---|---|---|---|---|
| AADR | Deaths | AADR | Deaths | AADR | Deaths | |
| American Indian | 560.0 | 434 | 408.5 | 364 | 481.4 | 798 |
| Asian/Pacific Islander | 650.6 | 7,582 | 422.7 | 6,006 | 523.6 | 13,588 |
| Black | 1,349.7 | 9,265 | 910.0 | 8,339 | 1,097.8 | 17,604 |
| Hispanic | 676.7 | 15,295 | 459.3 | 11,654 | 558.6 | 26,949 |
| White | 1,015.8 | 80,978 | 713.8 | 85,435 | 842.2 | 166,413 |
| Total | 951.4 | 113,554 | 667.1 | 111,798 | 790.7 | 225,352 |
Unknown values excluded from analysis: (Age) (98)
| Links to Additional Output Formats: · HTML Table · ASCII Text · dBASE III (Database) · CSV Format (Spreadsheet) Footnotes for Above Series of Analyses: Unique ID, for keeping track of analyses: 407KJNQF Date output made: Apr 7 2008 / 15:45:08 PST Seconds required to make output: 4 Output was produced by: California VitalWeb Wizard (www.ehdp.com) Date CGI server compiled: Mar 8 2008 / 00:17:18 PST (cau1-dgw-eg1) Analysis uses ICD System (ICD-9). Analysis uses underlying cause of death. Analysis uses area of residence of deceased. The death data source is California Department of Health Services. The population data source is California Department of Finance (12/2000). |