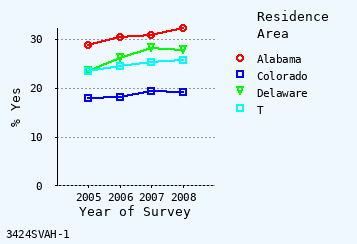
Is obese (BMI at least 30)?
Weighted Percent 'Yes'
Column Variable: Residence Area
Age: 18-99+ Years
Weighted Percent 'Yes'
Column Variable: Residence Area
Age: 18-99+ Years
| Year | Alabama | Colorado | Delaware | Total | ||||
|---|---|---|---|---|---|---|---|---|
| % Yes | n | % Yes | n | % Yes | n | % Yes | n | |
| 2005 | 28.9 | 3,069 | 17.8 | 5,733 | 23.5 | 4,001 | 23.3 | 12,803 |
| 2006 | 30.5 | 3,159 | 18.2 | 5,825 | 26.0 | 3,864 | 24.5 | 12,848 |
| 2007 | 30.9 | 6,915 | 19.3 | 11,421 | 28.2 | 3,856 | 25.3 | 22,192 |
| 2008 | 32.2 | 6,198 | 19.1 | 11,249 | 27.8 | 3,843 | 25.8 | 21,290 |
| Total | 30.6 | 19,341 | 18.6 | 34,228 | 26.4 | 15,564 | 24.7 | 69,133 |

Least-Squares Analysis, for Linear Trend (% Yes):
| Column | Trend | 2005 YI | Slope | 95% Slope CI | r * r | df | t Value |
|---|---|---|---|---|---|---|---|
| Alabama | Up | 29.037 | +1.0581 | +0.40 to +1.71 | 0.9604 | 2 | 4.302656 |
| Colorado | None | 17.868 | +0.4915 | -0.18 to +1.16 | 0.8331 | 2 | 4.302656 |
| Delaware | None | 24.099 | +1.5164 | -0.64 to +3.67 | 0.8208 | 2 | 4.302656 |
| Total | Up | 23.515 | +0.8100 | +0.33 to +1.29 | 0.9641 | 2 | 4.302656 |
Significant trend if confidence interval (CI) does not include 0.
Use Y-intercept (YI) and slope per year to draw trend line.
Use Y-intercept (YI) and slope per year to draw trend line.
Links to Additional Output Formats:
Unique ID for Analysis: 3424svah (3424SVAH)
Compiled / Run: Apr 24 2023 / Apr 24 2023
Platform / Run Time: VitalWeb Standard / 1 second
Data Scenario: United States State Level Adult BRFSS
n: Sample size (number of records used in the denominator)
Excluded responses: Missing, not asked, don't know, and refused.
_BMICAT______GE_30_: About how much do you weigh without shoes?
About how tall are you without shoes?
Data Source: CDC Behavioral Risk Factor Surveillance System