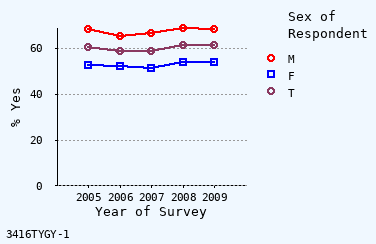
Is overweight or obese (BMI 25+)?
Weighted Percent 'Yes'
Age: 18-99+ Years
Place of Residence: California
Weighted Percent 'Yes'
Age: 18-99+ Years
Place of Residence: California
| Year | Male | Female | Total | |||
|---|---|---|---|---|---|---|
| % Yes | n | % Yes | n | % Yes | n | |
| 2005 | 68.3 | 2,357 | 52.9 | 3,569 | 60.6 | 5,926 |
| 2006 | 65.5 | 2,215 | 52.1 | 3,253 | 58.8 | 5,468 |
| 2007 | 66.7 | 2,134 | 51.2 | 3,335 | 59.0 | 5,469 |
| 2008 | 68.8 | 4,462 | 53.8 | 6,677 | 61.4 | 11,139 |
| 2009 | 68.5 | 6,692 | 53.9 | 9,737 | 61.3 | 16,429 |
| Total | 67.6 | 17,860 | 52.8 | 26,571 | 60.2 | 44,431 |

Least-Squares Analysis, for Linear Trend (% Yes):
| Column | Trend | 2005 YI | Slope | 95% Slope CI | r * r | df | t Value |
|---|---|---|---|---|---|---|---|
| Male | None | 66.799 | +0.3766 | -1.13 to +1.88 | 0.1740 | 3 | 3.182449 |
| Female | None | 52.011 | +0.3794 | -0.78 to +1.54 | 0.2656 | 3 | 3.182449 |
| Total | None | 59.392 | +0.4034 | -0.83 to +1.64 | 0.2643 | 3 | 3.182449 |
Significant trend if confidence interval (CI) does not include 0.
Use Y-intercept (YI) and slope per year to draw trend line.
Use Y-intercept (YI) and slope per year to draw trend line.
Links to Additional Output Formats:
Unique ID for Analysis: 3416tygy (3416TYGY)
Compiled / Run: Apr 5 2023 / Apr 16 2023
Platform / Run Time: VitalWeb Standard / 1 second
n: Sample size (number of records used in the denominator)
Data Scenario: United States State Level Adult BRFSS
Excluded responses: Missing, not asked, don't know, and refused.
_BMICAT______GE_25_: About how much do you weigh without shoes?
About how tall are you without shoes?
Data Source: CDC Behavioral Risk Factor Surveillance System