|
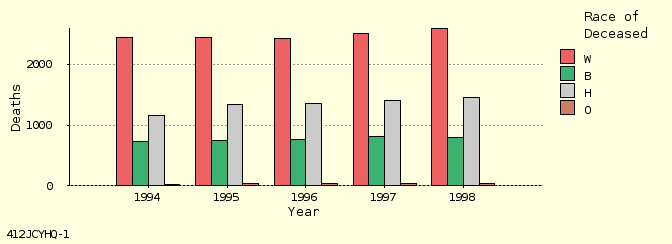
Deaths Place of Residence: Texas Causes of Death: Diabetes mellitus (250) |
| Year | White | Black | Hispanic | Other | Total |
|---|---|---|---|---|---|
| 1994 | 2,450 | 725 | 1,157 | 32 | 4,364 |
| 1995 | 2,439 | 751 | 1,344 | 35 | 4,569 |
| 1996 | 2,427 | 768 | 1,354 | 33 | 4,582 |
| 1997 | 2,504 | 810 | 1,403 | 36 | 4,753 |
| 1998 | 2,591 | 804 | 1,457 | 36 | 4,888 |
| Total | 12,411 | 3,858 | 6,715 | 172 | 23,156 |

Least-Squares Analysis, for Linear Trend
| Column | Trend | 1994 YI | Slope | 95% Slope CI | r * r | df | t Value |
|---|---|---|---|---|---|---|---|
| White | None | 2,412.8 | +34.700 | -11.1 to +80.5 | 0.6593 | 3 | 3.182449 |
| Black | Up | 728.20 | +21.700 | +9.73 to +33.7 | 0.9173 | 3 | 3.182449 |
| Hispanic | Up | 1,211.2 | +65.900 | +14.3 to +117 | 0.8463 | 3 | 3.182449 |
| Other | None | 32.600 | +0.9000 | -0.41 to +2.21 | 0.6136 | 3 | 3.182449 |
| Total | Up | 4,384.8 | +123.20 | +75.7 to +171 | 0.9578 | 3 | 3.182449 |
Significant trend if confidence interval (CI) does not include 0.
Use Y-intercept (YI) and slope per year to draw least-squares line.
|
Links to Additional Output Formats:
· HTML Table · Line Chart · ASCII Text · dBASE III (Database) · CSV (Spreadsheet) Unique ID, for keeping track of analyses: 412JCYHQ Compiled / run: Jan 12 2014 / Apr 12 2014 (1 second) (VitalWeb Standard) Data Scenario: Texas County Level ICD-9 Underlying Cause Deaths Death data source: Texas Department of State Health Services |