|
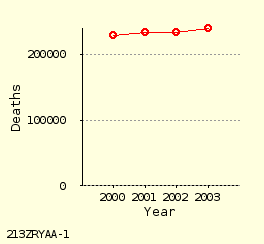
Deaths Place of Residence: California Cause of Death: All causes of death (ICD A00-Y89) |
| Year | Deaths |
|---|---|
| 2000 | 228,281 |
| 2001 | 232,790 |
| 2002 | 233,246 |
| 2003 | 239,325 |
| Total | 933,642 |
|
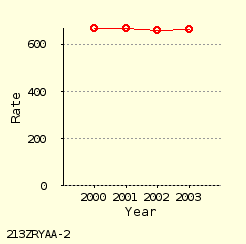
Death Rate (per 100,000) Place of Residence: California Cause of Death: All causes of death (ICD A00-Y89) |
| Year | Rate | Deaths |
|---|---|---|
| 2000 | 669.34 | 228,281 |
| 2001 | 669.13 | 232,790 |
| 2002 | 658.94 | 233,246 |
| 2003 | 664.89 | 239,325 |
| Total | 665.52 | 933,642 |
|
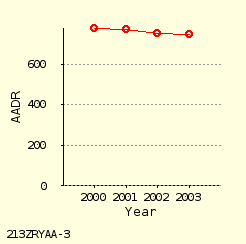
Age-Adjusted Death Rate (per 100,000) Place of Residence: California Cause of Death: All causes of death (ICD A00-Y89) |
| Year | AADR | Deaths |
|---|---|---|
| 2000 | 775.77 | 228,173 |
| 2001 | 768.69 | 232,685 |
| 2002 | 749.10 | 233,176 |
| 2003 | 746.49 | 239,243 |
| Total | 759.61 | 933,277 |
Unknown values excluded from analysis: (Age) (365)
|
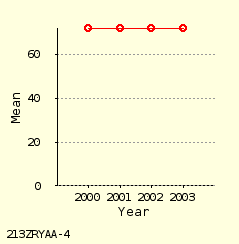
Mean Age of Death Place of Residence: California Cause of Death: All causes of death (ICD A00-Y89) |
| Year | Mean | Deaths |
|---|---|---|
| 2000 | 71.95 | 228,173 |
| 2001 | 71.90 | 232,685 |
| 2002 | 71.92 | 233,176 |
| 2003 | 71.90 | 239,243 |
| Total | 71.92 | 933,277 |
Unknown values excluded from analysis: (Age) (365)
|
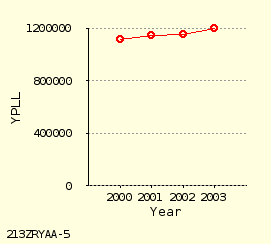
Years of Potential Life Lost (YPLL) to Age 65 Age: 0-64 Years Place of Residence: California Cause of Death: All causes of death (ICD A00-Y89) |
| Year | YPLL | Deaths |
|---|---|---|
| 2000 | 1,113,600.5 | 59,645 |
| 2001 | 1,147,013.5 | 61,831 |
| 2002 | 1,154,915.5 | 62,633 |
| 2003 | 1,199,972.0 | 65,568 |
| Total | 4,615,501.5 | 249,677 |
|
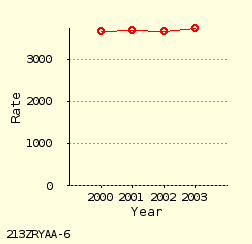
YPLL Rate (per 100,000) to Age 65 Age: 0-64 Years Place of Residence: California Cause of Death: All causes of death (ICD A00-Y89) |
| Year | Rate | Deaths |
|---|---|---|
| 2000 | 3,653.08 | 59,645 |
| 2001 | 3,687.83 | 61,831 |
| 2002 | 3,649.83 | 62,633 |
| 2003 | 3,730.51 | 65,568 |
| Total | 3,680.74 | 249,677 |
|
Links to Additional Output Formats:
· HTML Table · Pie Chart · Bar Chart · ASCII Text · CSV (Spreadsheet) Unique ID, for keeping track of analyses: 213ZRYAA Compiled / run: Feb 11 2012 / Feb 13 2012 (3 seconds) (VitalWeb Wizard) Age Adjustment Standard Population: 2000 US standard population Data Scenario: California County Level ICD-10 Underlying Cause Deaths Death data source: California Department of Health Services Population data source: California Department of Finance |