|
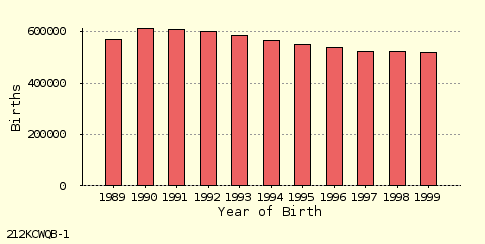
Births Mom's Place of Residence: California |
| Year | Births |
|---|---|
| 1989 | 569,308 |
| 1990 | 611,666 |
| 1991 | 609,228 |
| 1992 | 600,838 |
| 1993 | 584,483 |
| 1994 | 567,034 |
| 1995 | 551,226 |
| 1996 | 538,628 |
| 1997 | 524,174 |
| 1998 | 521,265 |
| 1999 | 518,073 |
| Total | 6,195,923 |
|
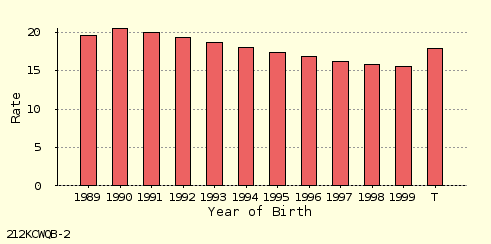
Birth Rate (per 1,000 People) Mom's Place of Residence: California |
| Year | Rate | Births |
|---|---|---|
| 1989 | 19.54 | 569,308 |
| 1990 | 20.51 | 611,666 |
| 1991 | 20.00 | 609,228 |
| 1992 | 19.39 | 600,838 |
| 1993 | 18.67 | 584,483 |
| 1994 | 17.99 | 567,034 |
| 1995 | 17.38 | 551,226 |
| 1996 | 16.85 | 538,628 |
| 1997 | 16.15 | 524,174 |
| 1998 | 15.86 | 521,265 |
| 1999 | 15.50 | 518,073 |
| Total | 17.93 | 6,195,923 |
|
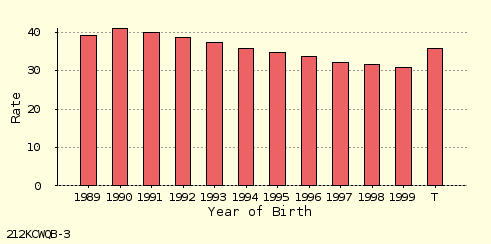
Birth Rate (per 1,000 Females) Mom's Place of Residence: California |
| Year | Rate | Births |
|---|---|---|
| 1989 | 39.08 | 569,308 |
| 1990 | 40.98 | 611,666 |
| 1991 | 39.96 | 609,228 |
| 1992 | 38.73 | 600,838 |
| 1993 | 37.27 | 584,483 |
| 1994 | 35.90 | 567,034 |
| 1995 | 34.68 | 551,226 |
| 1996 | 33.61 | 538,628 |
| 1997 | 32.20 | 524,174 |
| 1998 | 31.60 | 521,265 |
| 1999 | 30.88 | 518,073 |
| Total | 35.77 | 6,195,923 |
|
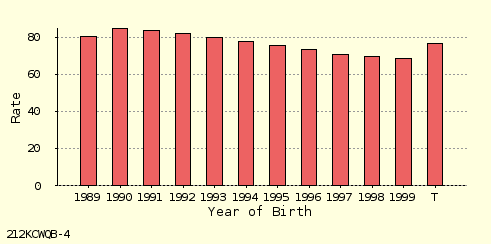
General Fertility Rate Mom's Place of Residence: California |
| Year | Rate | Births |
|---|---|---|
| 1989 | 80.43 | 569,308 |
| 1990 | 84.63 | 611,666 |
| 1991 | 83.44 | 609,228 |
| 1992 | 81.94 | 600,838 |
| 1993 | 79.74 | 584,483 |
| 1994 | 77.51 | 567,034 |
| 1995 | 75.46 | 551,226 |
| 1996 | 73.53 | 538,628 |
| 1997 | 70.74 | 524,174 |
| 1998 | 69.68 | 521,265 |
| 1999 | 68.63 | 518,073 |
| Total | 76.82 | 6,195,923 |
|
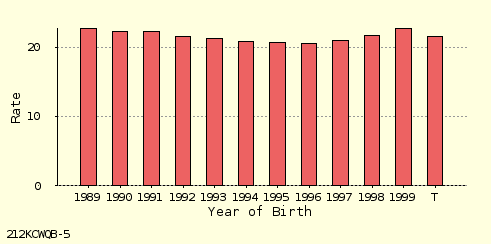
Total Cesarean Rate Mom's Place of Residence: California |
| Year | Rate | Births |
|---|---|---|
| 1989 | 22.69 | 128,904 |
| 1990 | 22.27 | 136,095 |
| 1991 | 22.28 | 135,618 |
| 1992 | 21.57 | 129,546 |
| 1993 | 21.32 | 124,559 |
| 1994 | 20.78 | 117,816 |
| 1995 | 20.61 | 113,623 |
| 1996 | 20.57 | 110,807 |
| 1997 | 20.99 | 109,995 |
| 1998 | 21.70 | 113,114 |
| 1999 | 22.69 | 117,568 |
| Total | 21.60 | 1,337,645 |
|
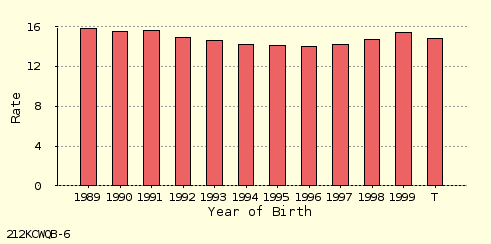
Primary Cesarean Rate Mom's Place of Residence: California |
| Year | Rate | Births |
|---|---|---|
| 1989 | 15.84 | 81,015 |
| 1990 | 15.52 | 85,392 |
| 1991 | 15.65 | 85,839 |
| 1992 | 14.91 | 80,448 |
| 1993 | 14.66 | 76,783 |
| 1994 | 14.26 | 72,498 |
| 1995 | 14.18 | 70,181 |
| 1996 | 14.01 | 67,589 |
| 1997 | 14.28 | 67,135 |
| 1998 | 14.69 | 68,560 |
| 1999 | 15.46 | 71,580 |
| Total | 14.88 | 827,020 |
|
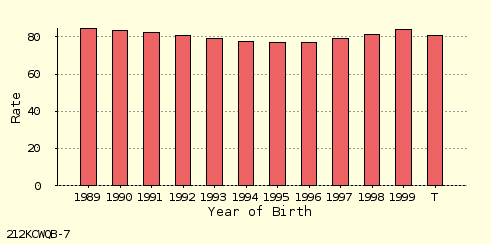
Repeat Cesarean Rate Mom's Place of Residence: California |
| Year | Rate | Births |
|---|---|---|
| 1989 | 84.48 | 47,889 |
| 1990 | 83.35 | 50,703 |
| 1991 | 82.37 | 49,779 |
| 1992 | 80.64 | 49,098 |
| 1993 | 79.22 | 47,776 |
| 1994 | 77.69 | 45,318 |
| 1995 | 77.02 | 43,442 |
| 1996 | 77.20 | 43,218 |
| 1997 | 79.36 | 42,860 |
| 1998 | 81.51 | 44,554 |
| 1999 | 83.73 | 45,988 |
| Total | 80.61 | 510,625 |
|
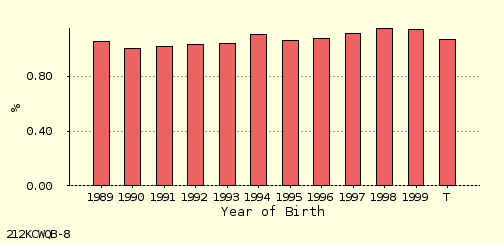
Percent Births < 1500 gms Mom's Place of Residence: California |
| Year | % | Births |
|---|---|---|
| 1989 | 1.06 | 6,018 |
| 1990 | 1.01 | 6,152 |
| 1991 | 1.02 | 6,223 |
| 1992 | 1.03 | 6,209 |
| 1993 | 1.04 | 6,099 |
| 1994 | 1.11 | 6,282 |
| 1995 | 1.07 | 5,877 |
| 1996 | 1.08 | 5,812 |
| 1997 | 1.12 | 5,869 |
| 1998 | 1.15 | 6,013 |
| 1999 | 1.15 | 5,950 |
| Total | 1.07 | 66,504 |
|
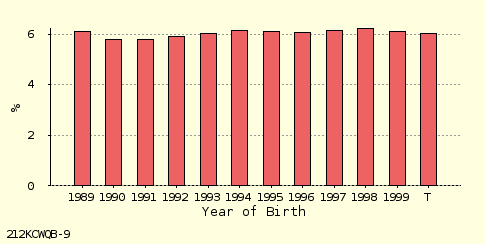
Percent Births < 2500 gms Mom's Place of Residence: California |
| Year | % | Births |
|---|---|---|
| 1989 | 6.10 | 34,737 |
| 1990 | 5.80 | 35,474 |
| 1991 | 5.80 | 35,359 |
| 1992 | 5.93 | 35,608 |
| 1993 | 6.01 | 35,116 |
| 1994 | 6.15 | 34,876 |
| 1995 | 6.09 | 33,588 |
| 1996 | 6.06 | 32,649 |
| 1997 | 6.15 | 32,232 |
| 1998 | 6.22 | 32,438 |
| 1999 | 6.12 | 31,686 |
| Total | 6.03 | 373,763 |
|
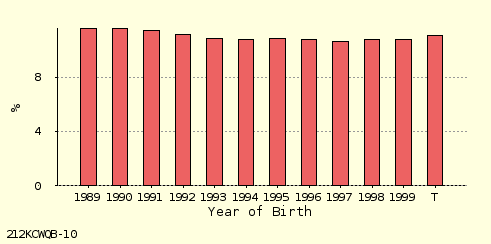
Percent Births > 3999 gms Mom's Place of Residence: California |
| Year | % | Births |
|---|---|---|
| 1989 | 11.61 | 66,104 |
| 1990 | 11.60 | 70,961 |
| 1991 | 11.49 | 70,018 |
| 1992 | 11.15 | 66,961 |
| 1993 | 10.88 | 63,595 |
| 1994 | 10.83 | 61,387 |
| 1995 | 10.89 | 60,022 |
| 1996 | 10.77 | 57,994 |
| 1997 | 10.67 | 55,954 |
| 1998 | 10.82 | 56,420 |
| 1999 | 10.82 | 56,080 |
| Total | 11.07 | 685,496 |
|
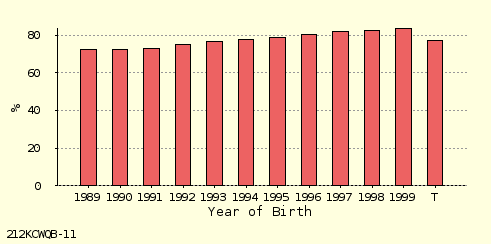
Percent Births with Early Prenatal Care Early Care Cutoff: Percent Before Month 4 Mom's Place of Residence: California |
| Year | % | Births |
|---|---|---|
| 1989 | 72.62 | 410,267 |
| 1990 | 72.35 | 438,407 |
| 1991 | 72.84 | 439,733 |
| 1992 | 75.09 | 447,434 |
| 1993 | 76.84 | 445,079 |
| 1994 | 77.74 | 437,094 |
| 1995 | 79.05 | 431,572 |
| 1996 | 80.59 | 428,724 |
| 1997 | 81.79 | 423,640 |
| 1998 | 82.39 | 422,866 |
| 1999 | 83.60 | 426,020 |
| Total | 77.49 | 4,750,836 |
|
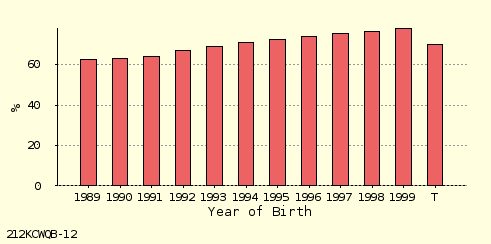
Percent Births with Adequate Kessner Mom's Place of Residence: California |
| Year | % | Births |
|---|---|---|
| 1989 | 62.43 | 338,301 |
| 1990 | 62.95 | 369,046 |
| 1991 | 64.23 | 374,513 |
| 1992 | 66.94 | 385,296 |
| 1993 | 69.28 | 386,118 |
| 1994 | 71.12 | 384,062 |
| 1995 | 72.30 | 377,144 |
| 1996 | 74.03 | 374,647 |
| 1997 | 75.67 | 372,074 |
| 1998 | 76.67 | 373,091 |
| 1999 | 77.98 | 375,128 |
| Total | 69.99 | 4,109,420 |
|
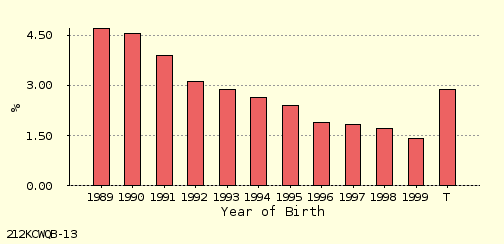
Percent Births with Inadequate Kessner Mom's Place of Residence: California |
| Year | % | Births |
|---|---|---|
| 1989 | 4.72 | 25,559 |
| 1990 | 4.57 | 26,767 |
| 1991 | 3.90 | 22,745 |
| 1992 | 3.14 | 18,075 |
| 1993 | 2.88 | 16,033 |
| 1994 | 2.64 | 14,275 |
| 1995 | 2.42 | 12,599 |
| 1996 | 1.89 | 9,561 |
| 1997 | 1.83 | 8,993 |
| 1998 | 1.71 | 8,321 |
| 1999 | 1.42 | 6,822 |
| Total | 2.89 | 169,750 |
|
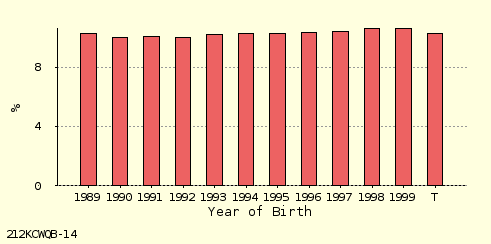
Percent Births Delivered Early Early Delivery Cutoff: Percent Before Week 37 Mom's Place of Residence: California |
| Year | % | Births |
|---|---|---|
| 1989 | 10.31 | 56,834 |
| 1990 | 10.05 | 59,758 |
| 1991 | 10.09 | 59,741 |
| 1992 | 10.03 | 58,534 |
| 1993 | 10.24 | 58,118 |
| 1994 | 10.29 | 56,548 |
| 1995 | 10.32 | 54,902 |
| 1996 | 10.34 | 53,471 |
| 1997 | 10.41 | 52,292 |
| 1998 | 10.63 | 52,861 |
| 1999 | 10.61 | 52,305 |
| Total | 10.29 | 615,364 |
|
Links to Additional Output Formats:
· HTML Table · Line Chart · ASCII Text · CSV (Spreadsheet) Unique ID, for keeping track of analyses: 212KCWQB Compiled / run: Feb 11 2012 / Feb 12 2012 (55 seconds) (VitalWeb Wizard) Denominators exclude births with unknown gestational age. Count in table is number of early deliveries (the numerator). Data Scenario: California County Level Birth Data Birth data source: California Department of Health Services |