|
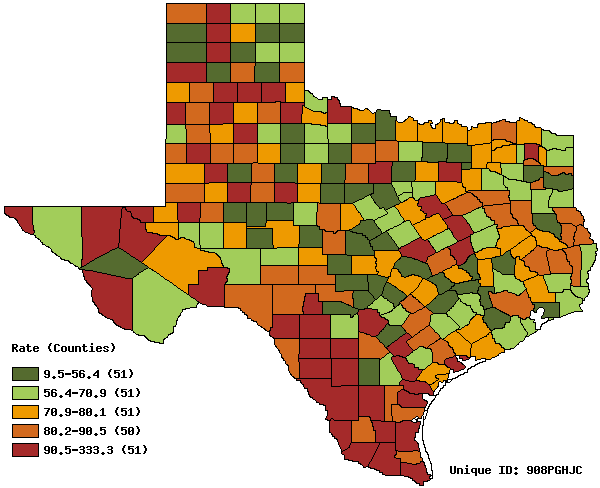
Texas Pregnancy Rate (per 1,000 females) Age of Mom: 15-19 Years Year of Outcome: 2000-2002 Displayed by: Mom's County of Residence |
|
Pregnancy Rate (per 1,000 females) Tabulated by Residence Area Age of Mom: 15-19 Years Year of Outcome: 2000-2002 |
| Residence Area | Rate | Outcomes |
|---|---|---|
| Anderson | 89.7 | 433 |
| Andrews | 89.9 | 171 |
| Angelina | 79.9 | 716 |
| Aransas | 79.4 | 182 |
| Archer | 38.6 | 42 |
| Armstrong | 85.8 | 20 |
| Atascosa | 80.8 | 419 |
| Austin | 67.5 | 189 |
| Bailey | 180.4 | 151 |
| Bandera | 40.7 | 81 |
| Bastrop | 76.8 | 494 |
| Baylor | 61.6 | 25 |
| Bee | 93.1 | 294 |
| Bell | 100.8 | 2,637 |
| Bexar | 92.4 | 15,021 |
| Blanco | 55.2 | 46 |
| Borden | 9.5 | 1 |
| Bosque | 74.7 | 134 |
| Bowie | 70.0 | 660 |
| Brazoria | 66.5 | 1,818 |
| Brazos | 38.1 | 1,113 |
| Brewster | 59.1 | 69 |
| Briscoe | 110.6 | 23 |
| Brooks | 125.2 | 129 |
| Brown | 73.8 | 338 |
| Burleson | 79.0 | 160 |
| Burnet | 71.5 | 253 |
| Caldwell | 90.5 | 337 |
| Calhoun | 96.7 | 228 |
| Callahan | 51.1 | 79 |
| Cameron | 102.7 | 4,686 |
| Camp | 84.7 | 98 |
| Carson | 28.2 | 24 |
| Cass | 57.5 | 193 |
| Castro | 87.9 | 100 |
| Chambers | 48.6 | 159 |
| Cherokee | 87.4 | 429 |
| Childress | 79.0 | 52 |
| Clay | 49.2 | 63 |
| Cochran | 61.3 | 40 |
| Coke | 48.8 | 21 |
| Coleman | 81.2 | 72 |
| Collin | 38.1 | 1,873 |
| Collingsworth | 82.7 | 31 |
| Colorado | 65.7 | 174 |
| Comal | 56.7 | 496 |
| Comanche | 70.9 | 105 |
| Concho | 45.5 | 14 |
| Cooke | 72.3 | 298 |
| Coryell | 61.2 | 441 |
| Cottle | 116.0 | 21 |
| Crane | 57.5 | 30 |
| Crockett | 69.0 | 38 |
| Crosby | 100.0 | 90 |
| Culberson | 97.6 | 37 |
| Dallam | 84.1 | 63 |
| Dallas | 96.0 | 22,235 |
| Dawson | 107.8 | 180 |
| Deaf Smith | 103.8 | 250 |
| Delta | 74.4 | 39 |
| Denton | 45.0 | 2,151 |
| DeWitt | 81.9 | 175 |
| Dickens | 58.1 | 15 |
| Dimmit | 95.6 | 131 |
| Donley | 46.1 | 20 |
| Duval | 94.1 | 157 |
| Eastland | 56.1 | 122 |
| Ector | 105.5 | 1,648 |
| Edwards | 82.3 | 19 |
| Ellis | 72.1 | 1,058 |
| El Paso | 91.7 | 8,039 |
| Erath | 52.0 | 234 |
| Falls | 67.1 | 150 |
| Fannin | 72.3 | 217 |
| Fayette | 48.2 | 115 |
| Fisher | 53.3 | 24 |
| Floyd | 76.8 | 76 |
| Foard | 71.0 | 12 |
| Fort Bend | 36.8 | 1,734 |
| Franklin | 58.4 | 59 |
| Freestone | 69.3 | 134 |
| Frio | 105.3 | 201 |
| Gaines | 71.7 | 161 |
| Galveston | 66.8 | 1,834 |
| Garza | 90.5 | 45 |
| Gillespie | 53.2 | 106 |
| Glasscock | 21.5 | 5 |
| Goliad | 63.1 | 51 |
| Gonzales | 89.6 | 203 |
| Gray | 66.5 | 148 |
| Grayson | 71.2 | 883 |
| Gregg | 82.8 | 1,056 |
| Grimes | 77.0 | 210 |
| Guadalupe | 58.9 | 643 |
| Hale | 106.5 | 478 |
| Hall | 100.5 | 39 |
| Hamilton | 65.6 | 49 |
| Hansford | 65.7 | 45 |
| Hardeman | 56.4 | 32 |
| Hardin | 60.6 | 351 |
| Harris | 82.8 | 30,966 |
| Harrison | 56.4 | 430 |
| Hartley | 29.1 | 13 |
| Haskell | 61.7 | 45 |
| Hays | 48.6 | 718 |
| Hemphill | 51.2 | 22 |
| Henderson | 86.6 | 624 |
| Hidalgo | 102.2 | 8,051 |
| Hill | 93.2 | 340 |
| Hockley | 89.9 | 286 |
| Hood | 58.8 | 241 |
| Hopkins | 72.1 | 256 |
| Houston | 75.3 | 176 |
| Howard | 99.2 | 361 |
| Hudspeth | 68.9 | 35 |
| Hunt | 76.0 | 656 |
| Hutchinson | 71.6 | 210 |
| Irion | 15.9 | 3 |
| Jack | 82.9 | 67 |
| Jackson | 74.3 | 131 |
| Jasper | 81.0 | 331 |
| Jeff Davis | 37.2 | 11 |
| Jefferson | 69.9 | 1,904 |
| Jim Hogg | 84.2 | 56 |
| Jim Wells | 90.0 | 466 |
| Johnson | 70.3 | 1,077 |
| Jones | 75.1 | 144 |
| Karnes | 99.6 | 144 |
| Kaufman | 72.5 | 647 |
| Kendall | 34.3 | 97 |
| Kenedy | 90.9 | 4 |
| Kent | 78.3 | 9 |
| Kerr | 81.5 | 356 |
| Kimble | 88.7 | 41 |
| King | 23.3 | 1 |
| Kinney | 97.8 | 35 |
| Kleberg | 85.7 | 339 |
| Knox | 69.8 | 34 |
| Lamar | 83.8 | 436 |
| Lamb | 89.0 | 176 |
| Lampasas | 54.0 | 121 |
| La Salle | 97.3 | 82 |
| Lavaca | 57.0 | 119 |
| Lee | 55.8 | 111 |
| Leon | 58.2 | 96 |
| Liberty | 76.7 | 618 |
| Limestone | 97.6 | 217 |
| Lipscomb | 63.9 | 23 |
| Live Oak | 65.5 | 80 |
| Llano | 73.7 | 87 |
| Loving | 333.3 | 2 |
| Lubbock | 78.6 | 2,495 |
| Lynn | 82.6 | 68 |
| McCulloch | 89.0 | 76 |
| McLennan | 76.4 | 2,261 |
| McMullen | 27.8 | 3 |
| Madison | 72.2 | 80 |
| Marion | 87.7 | 86 |
| Martin | 77.4 | 49 |
| Mason | 42.0 | 16 |
| Matagorda | 79.3 | 374 |
| Maverick | 81.1 | 549 |
| Medina | 67.9 | 332 |
| Menard | 77.5 | 21 |
| Midland | 84.8 | 1,297 |
| Milam | 87.8 | 238 |
| Mills | 46.3 | 26 |
| Mitchell | 84.3 | 71 |
| Montague | 76.9 | 153 |
| Montgomery | 56.7 | 1,994 |
| Moore | 103.0 | 274 |
| Morris | 75.2 | 104 |
| Motley | 86.3 | 12 |
| Nacogdoches | 46.3 | 465 |
| Navarro | 89.0 | 470 |
| Newton | 70.2 | 121 |
| Nolan | 93.8 | 166 |
| Nueces | 92.9 | 3,461 |
| Ochiltree | 66.4 | 73 |
| Oldham | 29.0 | 8 |
| Orange | 65.2 | 637 |
| Palo Pinto | 90.6 | 252 |
| Panola | 57.1 | 145 |
| Parker | 48.4 | 505 |
| Parmer | 74.7 | 101 |
| Pecos | 71.9 | 155 |
| Polk | 84.7 | 337 |
| Potter | 121.1 | 1,484 |
| Presidio | 91.8 | 104 |
| Rains | 73.1 | 70 |
| Randall | 47.0 | 606 |
| Reagan | 74.3 | 37 |
| Real | 96.2 | 28 |
| Red River | 76.0 | 110 |
| Reeves | 100.4 | 171 |
| Refugio | 77.8 | 74 |
| Roberts | 28.0 | 3 |
| Robertson | 95.8 | 164 |
| Rockwall | 39.4 | 214 |
| Runnels | 65.0 | 87 |
| Rusk | 65.1 | 339 |
| Sabine | 87.6 | 81 |
| San Augustine | 90.5 | 79 |
| San Jacinto | 76.5 | 178 |
| San Patricio | 98.1 | 826 |
| San Saba | 55.6 | 37 |
| Schleicher | 68.6 | 28 |
| Scurry | 84.3 | 164 |
| Shackelford | 42.6 | 16 |
| Shelby | 88.5 | 237 |
| Sherman | 90.7 | 33 |
| Smith | 70.9 | 1,427 |
| Somervell | 59.4 | 52 |
| Starr | 115.0 | 916 |
| Stephens | 88.1 | 101 |
| Sterling | 32.0 | 7 |
| Stonewall | 47.2 | 10 |
| Sutton | 82.2 | 35 |
| Swisher | 120.1 | 111 |
| Tarrant | 79.2 | 12,494 |
| Taylor | 76.6 | 1,199 |
| Terrell | 157.5 | 20 |
| Terry | 103.3 | 158 |
| Throckmorton | 14.2 | 3 |
| Titus | 106.3 | 340 |
| Tom Green | 78.5 | 1,039 |
| Travis | 78.0 | 6,451 |
| Trinity | 80.1 | 117 |
| Tyler | 86.7 | 174 |
| Upshur | 53.5 | 222 |
| Upton | 69.6 | 35 |
| Uvalde | 93.1 | 312 |
| Val Verde | 86.7 | 472 |
| Van Zandt | 65.8 | 351 |
| Victoria | 81.3 | 852 |
| Walker | 45.9 | 326 |
| Waller | 53.1 | 289 |
| Ward | 79.1 | 116 |
| Washington | 50.7 | 209 |
| Webb | 121.2 | 3,227 |
| Wharton | 78.3 | 418 |
| Wheeler | 67.6 | 38 |
| Wichita | 79.3 | 1,179 |
| Wilbarger | 97.8 | 175 |
| Willacy | 87.6 | 234 |
| Williamson | 48.9 | 1,389 |
| Wilson | 47.8 | 190 |
| Winkler | 75.6 | 77 |
| Wise | 63.0 | 353 |
| Wood | 70.0 | 264 |
| Yoakum | 87.6 | 100 |
| Young | 88.4 | 163 |
| Zapata | 113.1 | 187 |
| Zavala | 107.2 | 167 |
| Total | 80.1 | 192,755 |
Overall Unknown Geographic Areas for Columns (Added to Column Totals): 1171 Total
| Links to Additional Output Formats: · ASCII Text · dBASE III (Database) · Tab-Delimited (Spreadsheet) Analysis Footnotes: · Unique ID, for keeping track of analyses: 908PGHJC · Date Produced: Thu Sep 8 15:23:48 2005 · Produced by: Texas VitalWeb (www.ehdp.com) · Pregnancies Classified by: Mom's County of Residence · Pregnancy Excluded if Unknown Whether In-State or Out-Of-State Resident · Pregnancy Outcome Data Source: Texas Department of Health · Population Data Source: Texas State Data Center (1/2005) |