|
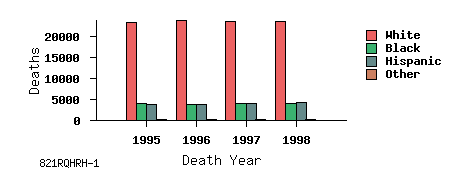
Deaths Tabulated by Death Year and Race Place of Residence: Texas Cause of Death: Malignant neoplasms [cancer] (ICD 140-208) |
| Death Year | White | Black | Hispanic | Other | Total |
|---|---|---|---|---|---|
| 1995 | 23,305 | 4,060 | 3,953 | 253 | 31,571 |
| 1996 | 23,712 | 4,007 | 3,993 | 247 | 31,959 |
| 1997 | 23,626 | 4,042 | 4,192 | 284 | 32,144 |
| 1998 | 23,515 | 4,087 | 4,387 | 286 | 32,275 |
| Total | 94,158 | 16,196 | 16,525 | 1,070 | 127,949 |
Detailed Least-Squares Analysis, to Detect Linear Trend:
| Column | 1995 Y-intercept | Slope | 95% CI (2 df, t=4.3027) |
|---|---|---|---|
| White | 23,458 | +54.40 | -325.7 to +434.5 |
| Black | 4,032 | +11.60 | -59.17 to +82.37 |
| Hispanic | 3,906 | +150.1 | +33.57 to +266.6 ** |
| Other | 247.1 | +13.60 | -10.75 to +37.95 |
| Total | 31,643 | +229.7 | +49.08 to +410.3 ** |
Y-intercept and slope may be used to draw least-squares line.
If confidence interval (CI) does not include 0, trend is significant [**].
| Links to Additional Output Formats: · HTML Table · Line Chart · ASCII Text · dBASE III (Database) · Tab-Delimited (Spreadsheet) Analysis Footnotes: · Unique ID, for keeping track of analyses: 821RQHRH · Date Produced: Sun Aug 21 23:59:08 2005 · Produced by: Texas VitalWeb (www.ehdp.com) · Deaths Classified by: 9th Int. Classification of Diseases (ICD-9) · Deaths Classified by: Underlying Cause, County of Residence · Mortality Data Source: Texas Department of Health |