|
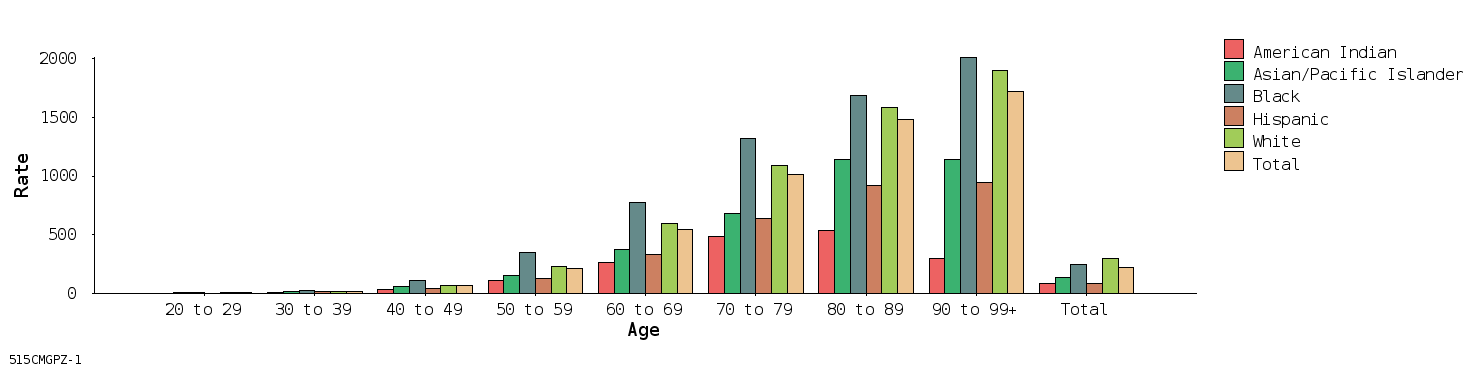
Death Rate (per 100,000) Row Variable: Age Column Variable: Race Year of Death: 1993 to 1998 Place of Residence: California Cause of Death: Malignant neoplasms [cancer] (ICD 140-208) |
| Age | American Indian | Asian/Pacific Islander | Black | Hispanic | White | Total | ||||||
|---|---|---|---|---|---|---|---|---|---|---|---|---|
| Rate | Deaths | Rate | Deaths | Rate | Deaths | Rate | Deaths | Rate | Deaths | Rate | Deaths | |
| 20 to 29 | 3.9 | 7 | 6.8 | 218 | 7.2 | 160 | 5.8 | 590 | 6.7 | 876 | 6.4 | 1,851 |
| 30 to 39 | 9.8 | 20 | 17.6 | 638 | 27.5 | 671 | 14.5 | 1,426 | 19.4 | 3,514 | 18.3 | 6,269 |
| 40 to 49 | 39.5 | 72 | 58.5 | 1,808 | 111.0 | 2,037 | 45.2 | 2,740 | 70.2 | 11,598 | 65.9 | 18,255 |
| 50 to 59 | 113.2 | 139 | 158.5 | 2,806 | 350.4 | 3,898 | 129.7 | 4,117 | 228.4 | 25,667 | 210.3 | 36,627 |
| 60 to 69 | 266.9 | 191 | 372.1 | 4,552 | 776.1 | 5,739 | 335.4 | 6,839 | 599.6 | 51,649 | 543.6 | 68,970 |
| 70 to 79 | 484.9 | 207 | 678.6 | 5,410 | 1,316.3 | 6,292 | 638.2 | 7,286 | 1,091.8 | 79,191 | 1,013.0 | 98,386 |
| 80 to 89 | 536.1 | 94 | 1,139.7 | 3,186 | 1,682.5 | 3,116 | 921.5 | 4,064 | 1,582.8 | 51,913 | 1,484.0 | 62,373 |
| 90 to 99+ | 298.2 | 13 | 1,139.2 | 591 | 2,008.1 | 652 | 944.0 | 892 | 1,900.6 | 10,369 | 1,717.6 | 12,517 |
| Total | 89.9 | 743 | 136.8 | 19,209 | 249.6 | 22,565 | 85.0 | 27,954 | 299.0 | 234,777 | 225.6 | 305,248 |
Unknown values omitted from table: (Age) (4)
| Links to Additional Output Formats: · HTML Table · Line Chart · ASCII Text · dBASE III (Database) · CSV (Spreadsheet) Analysis Footnotes: Unique ID, for keeping track of analyses: 515CMGPZ Date output made: May 15 2008 / 22:04:56 PST Seconds required to make output: 2 Output was produced by: California VitalWeb Wizard (www.ehdp.com) Date CGI server compiled: May 14 2008 / 01:40:12 CST Analysis uses ICD System (ICD-9). Analysis uses underlying cause of death. Analysis uses area of residence of deceased. The death data source is California Department of Health Services. The population data source is California Department of Finance (12/2000). |